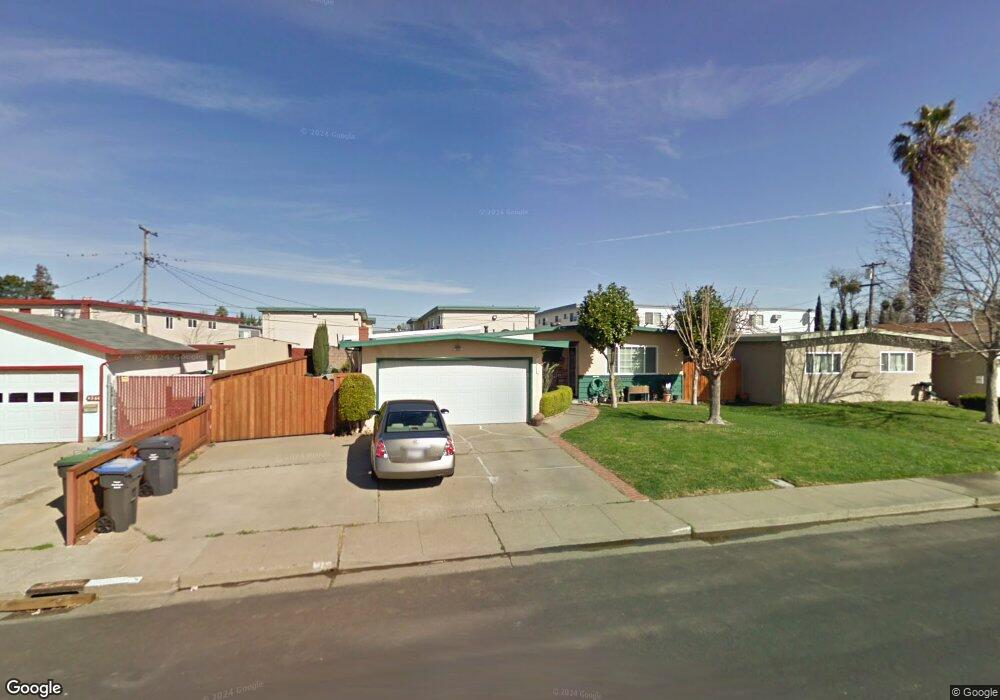
442 San Jose St Fairfield, CA 94533
Estimated Value: $458,000 - $495,000
3
Beds
2
Baths
1,287
Sq Ft
$372/Sq Ft
Est. Value
About This Home
This home is located at 442 San Jose St, Fairfield, CA 94533 and is currently estimated at $479,210, approximately $372 per square foot. 442 San Jose St is a home located in Solano County with nearby schools including Anna Kyle Elementary School, Grange Middle School, and Fairfield High School.
Ownership History
Date
Name
Owned For
Owner Type
Purchase Details
Closed on
Jan 21, 2003
Sold by
Monroy Ignacio and Monroy Lisa
Bought by
Monroy Ignacio and Monroy Lisa
Current Estimated Value
Home Financials for this Owner
Home Financials are based on the most recent Mortgage that was taken out on this home.
Original Mortgage
$125,800
Interest Rate
5.97%
Create a Home Valuation Report for This Property
The Home Valuation Report is an in-depth analysis detailing your home's value as well as a comparison with similar homes in the area
Home Values in the Area
Average Home Value in this Area
Purchase History
| Date | Buyer | Sale Price | Title Company |
|---|---|---|---|
| Monroy Ignacio | $63,000 | Fidelity Title Co |
Source: Public Records
Mortgage History
| Date | Status | Borrower | Loan Amount |
|---|---|---|---|
| Closed | Monroy Ignacio | $125,800 |
Source: Public Records
Tax History Compared to Growth
Tax History
| Year | Tax Paid | Tax Assessment Tax Assessment Total Assessment is a certain percentage of the fair market value that is determined by local assessors to be the total taxable value of land and additions on the property. | Land | Improvement |
|---|---|---|---|---|
| 2025 | $2,932 | $268,323 | $65,873 | $202,450 |
| 2024 | $2,932 | $263,063 | $64,582 | $198,481 |
| 2023 | $2,841 | $257,906 | $63,316 | $194,590 |
| 2022 | $2,805 | $252,850 | $62,075 | $190,775 |
| 2021 | $2,776 | $247,893 | $60,858 | $187,035 |
| 2020 | $2,710 | $245,352 | $60,234 | $185,118 |
| 2019 | $2,642 | $240,542 | $59,053 | $181,489 |
| 2018 | $2,726 | $235,827 | $57,896 | $177,931 |
| 2017 | $2,599 | $231,204 | $56,761 | $174,443 |
| 2016 | $2,574 | $226,672 | $55,649 | $171,023 |
| 2015 | $2,402 | $223,269 | $54,814 | $168,455 |
| 2014 | $2,378 | $218,897 | $53,741 | $165,156 |
Source: Public Records
Map
Nearby Homes
- 431 San Jose St
- 1653 San Diego St
- 1812 San Jose Place
- 1669 Rutledge Ln
- 1667 Vicksburg Dr
- 324 San Andreas St
- 1870 San Pedro Ct
- 133 E Travis Blvd
- 2024 San Luis St
- 1700 Fillmore St
- 831 San Remo St
- 224 E Colorado St
- 1207 E Tennessee St
- 518 Carolina St
- 1831 Clay St
- 919 Brandon Way
- 367 E Pacific Ave
- 987 Daniel St
- 141 Summertime Ln
- 145 Summertime Ln
- 448 San Jose St
- 447 San Marco St Unit 2
- 454 San Jose St
- 457 San Marco St
- 430 San Jose St
- 443 San Jose St
- 433 San Marco St
- 437 San Jose St
- 449 San Jose St
- 460 San Jose St
- 424 San Jose St
- 1713 San Bruno St
- 461 San Marco St
- 425 San Jose St
- 442 San Mateo St
- 436 San Mateo St
- 419 San Marco St
- 419 San Marco St Unit 8
- 500 San Jose St