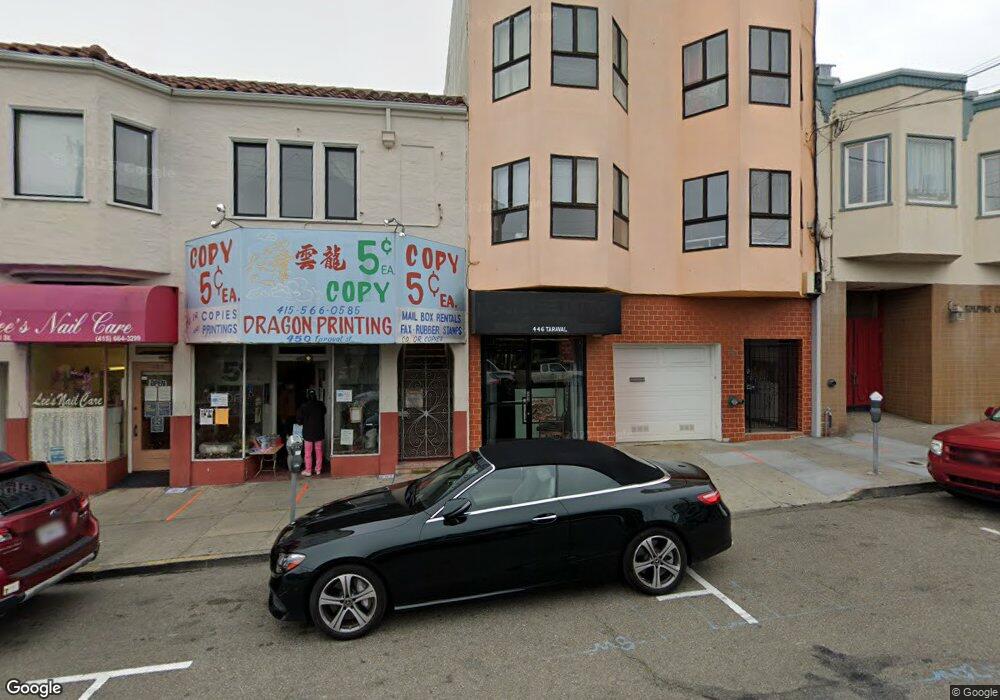
442 Taraval St Unit 446 San Francisco, CA 94116
Golden Gate Heights NeighborhoodEstimated Value: $2,161,160 - $2,414,000
10
Beds
8
Baths
5,262
Sq Ft
$438/Sq Ft
Est. Value
About This Home
This home is located at 442 Taraval St Unit 446, San Francisco, CA 94116 and is currently estimated at $2,303,040, approximately $437 per square foot. 442 Taraval St Unit 446 is a home located in San Francisco County with nearby schools including West Portal Elementary School and Hoover (Herbert) Middle School.
Ownership History
Date
Name
Owned For
Owner Type
Purchase Details
Closed on
Feb 10, 2021
Sold by
Luk Samuel S and Luk Catherine Y
Bought by
Luk Louisa and The Luk Irrevocable Trust
Current Estimated Value
Purchase Details
Closed on
Aug 13, 2013
Sold by
Luk Louisa
Bought by
Luk Samuel and Luk Catherine
Purchase Details
Closed on
Dec 26, 2012
Sold by
Yang Justin James
Bought by
Luk Louisa
Purchase Details
Closed on
May 30, 2002
Sold by
Hanes Robert A and Bennett Christine R
Bought by
Ryals Kathleen and Hedgpeth Todd C
Purchase Details
Closed on
May 28, 1998
Sold by
Lan Ma King
Bought by
Luk Samuel S and Luk Catherine Y L
Home Financials for this Owner
Home Financials are based on the most recent Mortgage that was taken out on this home.
Original Mortgage
$400,000
Interest Rate
7.17%
Mortgage Type
Commercial
Create a Home Valuation Report for This Property
The Home Valuation Report is an in-depth analysis detailing your home's value as well as a comparison with similar homes in the area
Home Values in the Area
Average Home Value in this Area
Purchase History
| Date | Buyer | Sale Price | Title Company |
|---|---|---|---|
| Luk Louisa | -- | None Available | |
| Luk Samuel | -- | None Available | |
| Luk Louisa | -- | None Available | |
| Luk Louisa | -- | None Available | |
| Ryals Kathleen | $906,000 | Fidelity National Title Co | |
| Luk Samuel S | $660,000 | Old Republic Title Company | |
| Ma King Lan | -- | Old Republic Title Company |
Source: Public Records
Mortgage History
| Date | Status | Borrower | Loan Amount |
|---|---|---|---|
| Previous Owner | Luk Samuel S | $400,000 |
Source: Public Records
Tax History Compared to Growth
Tax History
| Year | Tax Paid | Tax Assessment Tax Assessment Total Assessment is a certain percentage of the fair market value that is determined by local assessors to be the total taxable value of land and additions on the property. | Land | Improvement |
|---|---|---|---|---|
| 2025 | $13,448 | $1,053,811 | $574,809 | $479,002 |
| 2024 | $13,448 | $1,033,150 | $563,539 | $469,611 |
| 2023 | $13,111 | $1,012,894 | $552,490 | $460,404 |
| 2022 | $12,814 | $993,035 | $541,658 | $451,377 |
| 2021 | $12,592 | $973,560 | $531,036 | $442,524 |
| 2020 | $12,654 | $963,613 | $525,607 | $438,006 |
| 2019 | $12,233 | $944,719 | $515,301 | $429,418 |
| 2018 | $11,834 | $926,197 | $505,198 | $420,999 |
| 2017 | $11,400 | $908,038 | $495,293 | $412,745 |
| 2016 | $11,212 | $890,234 | $485,582 | $404,652 |
| 2015 | $11,076 | $876,863 | $478,289 | $398,574 |
| 2014 | $10,794 | $859,687 | $468,920 | $390,767 |
Source: Public Records
Map
Nearby Homes
- 634-636 Taraval St
- 2292 16th Ave
- 353 Rivera St
- 2475 18th Ave
- 730 Santiago St
- 160 Wawona St
- 2418 20th Ave Unit 101
- 2123 Funston Ave
- 2266 9th Ave
- 701 Quintara St
- 270 Claremont Blvd
- 2116 18th Ave
- 325 Wawona St
- 2114 20th Ave
- 8 San Lorenzo Way
- 1983 15th Ave
- 44 Yerba Buena Ave
- 111 Edgehill Way
- 1414 Taraval St
- 2050 22nd Ave
- 448 Taraval St
- 2376 15th Ave Unit 2378
- 424 Taraval St
- 420 Taraval St
- 2372 15th Ave
- 2379 14th Ave
- 2366 15th Ave
- 410 Taraval St
- 2373 14th Ave
- 500 Taraval St
- 502 Taraval St
- 2360 15th Ave
- 2367 14th Ave
- 508 Taraval St
- 506 Taraval St
- 419 Taraval St
- 445 Taraval St
- 2356 15th Ave
- 2359 14th Ave
- 501 Taraval St