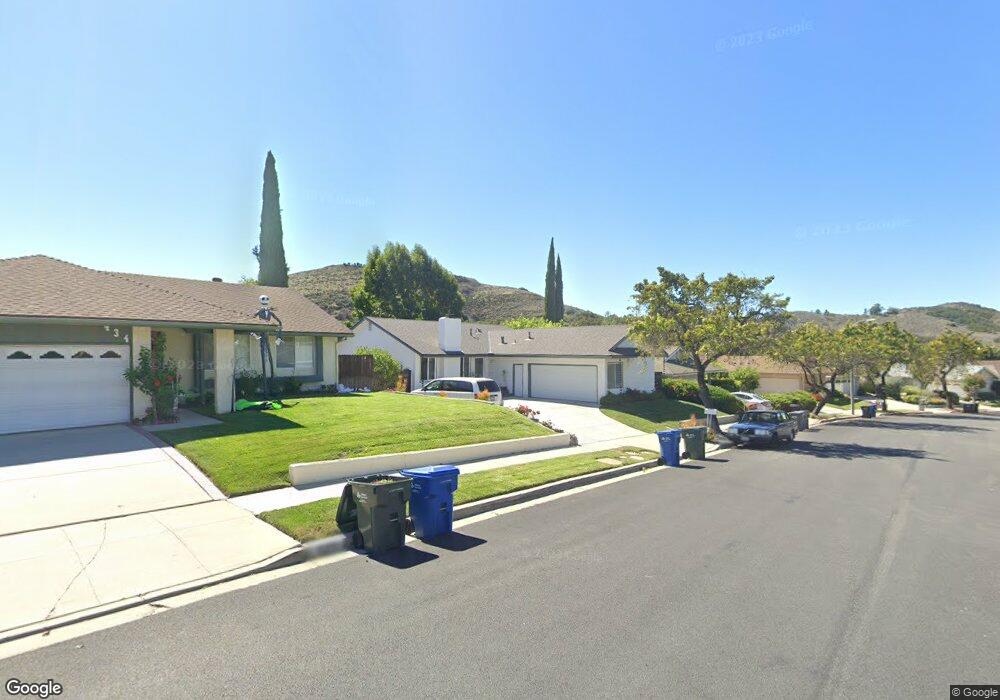
442 W Avenida de Las Flores Thousand Oaks, CA 91360
Estimated Value: $830,000 - $961,000
4
Beds
2
Baths
1,386
Sq Ft
$652/Sq Ft
Est. Value
About This Home
This home is located at 442 W Avenida de Las Flores, Thousand Oaks, CA 91360 and is currently estimated at $903,663, approximately $651 per square foot. 442 W Avenida de Las Flores is a home located in Ventura County with nearby schools including Wildwood Elementary School, Redwood Middle School, and Thousand Oaks High School.
Ownership History
Date
Name
Owned For
Owner Type
Purchase Details
Closed on
Mar 5, 2004
Sold by
Peterson Jeffrey S
Bought by
Turpel Patricia
Current Estimated Value
Home Financials for this Owner
Home Financials are based on the most recent Mortgage that was taken out on this home.
Original Mortgage
$363,000
Outstanding Balance
$158,657
Interest Rate
4.75%
Mortgage Type
Purchase Money Mortgage
Estimated Equity
$745,006
Purchase Details
Closed on
Jun 24, 1999
Sold by
Patricia Peterson Jeffrey S Turpel
Bought by
Peterson Jeffrey S and Turpel Patricia
Home Financials for this Owner
Home Financials are based on the most recent Mortgage that was taken out on this home.
Original Mortgage
$188,000
Interest Rate
5.75%
Create a Home Valuation Report for This Property
The Home Valuation Report is an in-depth analysis detailing your home's value as well as a comparison with similar homes in the area
Home Values in the Area
Average Home Value in this Area
Purchase History
| Date | Buyer | Sale Price | Title Company |
|---|---|---|---|
| Turpel Patricia | -- | Equity Title Company | |
| Peterson Jeffrey S | -- | First American Title Ins Co |
Source: Public Records
Mortgage History
| Date | Status | Borrower | Loan Amount |
|---|---|---|---|
| Open | Turpel Patricia | $363,000 | |
| Previous Owner | Peterson Jeffrey S | $188,000 |
Source: Public Records
Tax History Compared to Growth
Tax History
| Year | Tax Paid | Tax Assessment Tax Assessment Total Assessment is a certain percentage of the fair market value that is determined by local assessors to be the total taxable value of land and additions on the property. | Land | Improvement |
|---|---|---|---|---|
| 2025 | $4,070 | $350,052 | $140,018 | $210,034 |
| 2024 | $4,070 | $343,189 | $137,273 | $205,916 |
| 2023 | $3,937 | $336,460 | $134,581 | $201,879 |
| 2022 | $3,864 | $329,863 | $131,942 | $197,921 |
| 2021 | $3,794 | $323,396 | $129,355 | $194,041 |
| 2020 | $3,390 | $320,082 | $128,030 | $192,052 |
| 2019 | $3,300 | $313,807 | $125,520 | $188,287 |
| 2018 | $3,233 | $307,655 | $123,059 | $184,596 |
| 2017 | $3,170 | $301,624 | $120,647 | $180,977 |
| 2016 | $3,139 | $295,711 | $118,282 | $177,429 |
| 2015 | $3,084 | $291,271 | $116,506 | $174,765 |
| 2014 | $3,039 | $285,568 | $114,225 | $171,343 |
Source: Public Records
Map
Nearby Homes
- 2531 Scott Place
- 579 Shenandoah St
- 2590 Scott Place
- 224 Whitworth St
- 479 Serento Cir
- 2680 La Paloma Cir
- 463 Serento Cir
- 579 Rio Grande Cir
- 226 Tennyson St
- 183 W Sidlee St
- 136 Erten St
- 167 Siesta Ave
- 497 Azalea St
- 2084 Hopewell Ct
- 212 Cedar Heights Dr
- 360 Massey St
- 2651 Sirius St
- 3037 Fort Courage Ave
- 111 Donnick Ave
- 674 Lautrec Ct
- 434 W Avenida de Las Flores
- 434 W Avenida de Las Flores
- 450 W Avenida de Las Flores
- 426 W Avenida de Las Flores
- 458 W Avenida de Las Flores
- 418 W Avenida de Las Flores
- 445 W Avenida de Las Flores
- 439 W Avenida de Las Flores
- 2451 Dillon Ct
- 461 W Avenida de Las Flores
- 410 W Avenida de Las Flores
- 472 W Avenida de Las Flores
- 2459 Dillon Ct
- 444 Fargo St
- 458 Fargo St
- 480 W Avenida de Las Flores
- 2452 Dillon Ct
- 485 W Avenida de Las Flores
- 2465 Dillon Ct
- 445 Fargo St