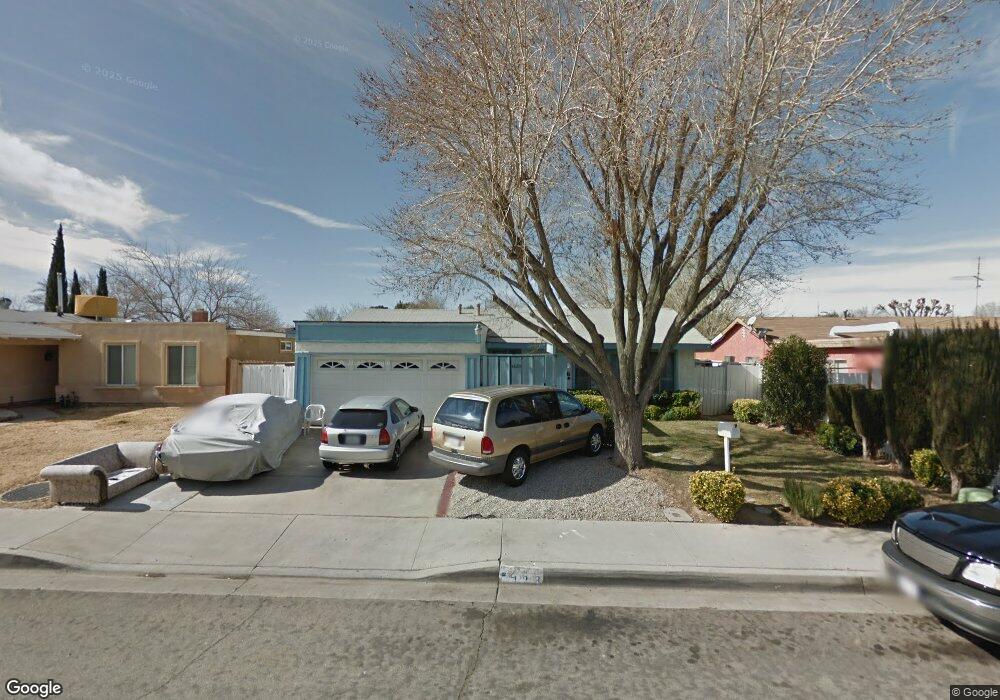
44203 4th St E Lancaster, CA 93535
East Lancaster NeighborhoodEstimated Value: $365,000 - $435,000
4
Beds
2
Baths
1,497
Sq Ft
$265/Sq Ft
Est. Value
About This Home
This home is located at 44203 4th St E, Lancaster, CA 93535 and is currently estimated at $396,814, approximately $265 per square foot. 44203 4th St E is a home located in Los Angeles County with nearby schools including Joshua Elementary, New Vista Middle School, and Antelope Valley High School.
Ownership History
Date
Name
Owned For
Owner Type
Purchase Details
Closed on
Feb 18, 1999
Sold by
Hud
Bought by
Laparra Ricardo
Current Estimated Value
Home Financials for this Owner
Home Financials are based on the most recent Mortgage that was taken out on this home.
Original Mortgage
$52,045
Outstanding Balance
$12,350
Interest Rate
6.77%
Mortgage Type
FHA
Estimated Equity
$384,464
Purchase Details
Closed on
Feb 15, 1999
Sold by
Laparra Flora
Bought by
Laparra Ricardo
Home Financials for this Owner
Home Financials are based on the most recent Mortgage that was taken out on this home.
Original Mortgage
$52,045
Outstanding Balance
$12,350
Interest Rate
6.77%
Mortgage Type
FHA
Estimated Equity
$384,464
Purchase Details
Closed on
Jan 21, 1997
Sold by
Principal Residential Mtg Inc
Bought by
Hud
Purchase Details
Closed on
Jan 8, 1997
Sold by
Deleon Leopoldo G
Bought by
Principal Residential Mtg Inc
Create a Home Valuation Report for This Property
The Home Valuation Report is an in-depth analysis detailing your home's value as well as a comparison with similar homes in the area
Home Values in the Area
Average Home Value in this Area
Purchase History
| Date | Buyer | Sale Price | Title Company |
|---|---|---|---|
| Laparra Ricardo | $55,000 | Universal Title Co | |
| Laparra Ricardo | -- | Universal Title Company | |
| Hud | -- | United Independent Title | |
| Principal Residential Mtg Inc | $111,301 | -- |
Source: Public Records
Mortgage History
| Date | Status | Borrower | Loan Amount |
|---|---|---|---|
| Open | Laparra Ricardo | $52,045 |
Source: Public Records
Tax History
| Year | Tax Paid | Tax Assessment Tax Assessment Total Assessment is a certain percentage of the fair market value that is determined by local assessors to be the total taxable value of land and additions on the property. | Land | Improvement |
|---|---|---|---|---|
| 2025 | $2,773 | $126,649 | $23,506 | $103,143 |
| 2024 | $2,773 | $124,167 | $23,046 | $101,121 |
| 2023 | $2,719 | $121,734 | $22,595 | $99,139 |
| 2022 | $2,643 | $119,348 | $22,152 | $97,196 |
| 2021 | $2,264 | $117,009 | $21,718 | $95,291 |
| 2019 | $2,207 | $113,540 | $21,075 | $92,465 |
| 2018 | $2,169 | $111,314 | $20,662 | $90,652 |
| 2016 | $2,061 | $106,993 | $19,860 | $87,133 |
| 2015 | $2,038 | $105,387 | $19,562 | $85,825 |
| 2014 | $2,041 | $103,323 | $19,179 | $84,144 |
Source: Public Records
Map
Nearby Homes
- 44202 4th St E
- 44213 4th St E
- 44188 Glenraven Rd
- 44034 4th St E
- 44101 Kirkland Ave
- 44025 Glenraven Rd
- 44306 3rd St E
- 44309 Gingham Ave
- 519 E Avenue J 4
- 44325 3rd St E
- 44329 3rd St E
- 43963 Glenraven Rd
- 44214 2nd St E
- 44022 Stanridge Ave
- 143 E Avenue j7
- 44125 Rodin Ave
- 47500 5th St E
- 44047 Rodin Ave
- 44335 Glenraven Rd
- 443 Corona Ct
- 44209 4th St E
- 44147 4th St E
- 44209 4th St E
- 44200 Kirkland Ave
- 44172 Kirkland Ave
- 44141 4th St E
- 44208 Kirkland Ave
- 44166 Kirkland Ave
- 44214 Kirkland Ave
- 44208 4th St E
- 44146 4th St E
- 44133 4th St E
- 44212 4th St E
- 44160 Kirkland Ave
- 44140 4th St E
- 44220 Kirkland Ave
- 44129 4th St E
- 44220 4th St E
- 44227 4th St E
- 44132 4th St E
Your Personal Tour Guide
Ask me questions while you tour the home.