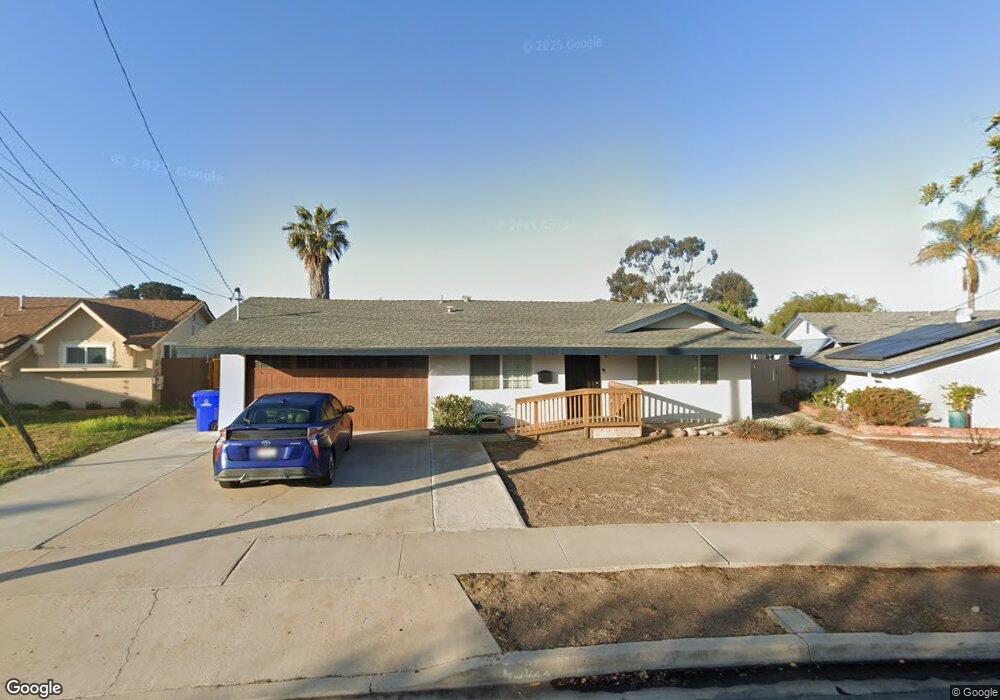
4422 Bertha St San Diego, CA 92117
North Clairemont NeighborhoodEstimated Value: $1,112,355 - $1,194,000
3
Beds
2
Baths
1,099
Sq Ft
$1,052/Sq Ft
Est. Value
About This Home
This home is located at 4422 Bertha St, San Diego, CA 92117 and is currently estimated at $1,156,589, approximately $1,052 per square foot. 4422 Bertha St is a home located in San Diego County with nearby schools including Field Elementary School, Innovation Middle School, and Madison High School.
Ownership History
Date
Name
Owned For
Owner Type
Purchase Details
Closed on
Jul 14, 2014
Sold by
Fannie Mae
Bought by
Atalla Patricia
Current Estimated Value
Home Financials for this Owner
Home Financials are based on the most recent Mortgage that was taken out on this home.
Original Mortgage
$295,000
Outstanding Balance
$224,280
Interest Rate
4.11%
Mortgage Type
New Conventional
Estimated Equity
$932,309
Purchase Details
Closed on
Mar 17, 2011
Sold by
Aboulhosn Afif and Aboulhosn Maha F
Bought by
Federal National Mortgage Association
Purchase Details
Closed on
Jul 25, 2006
Sold by
Cagle Thomas
Bought by
Aboulhosn Afif and Aboulhosn Maha F
Home Financials for this Owner
Home Financials are based on the most recent Mortgage that was taken out on this home.
Original Mortgage
$380,800
Interest Rate
6.5%
Mortgage Type
Purchase Money Mortgage
Purchase Details
Closed on
Aug 19, 2003
Sold by
Cagle Patricia Ryan
Bought by
Cagle Thomas and Cagle Patricia
Create a Home Valuation Report for This Property
The Home Valuation Report is an in-depth analysis detailing your home's value as well as a comparison with similar homes in the area
Home Values in the Area
Average Home Value in this Area
Purchase History
| Date | Buyer | Sale Price | Title Company |
|---|---|---|---|
| Atalla Patricia | $550,000 | Lsi Title Company | |
| Federal National Mortgage Association | $419,006 | None Available | |
| Aboulhosn Afif | $476,000 | First American Title | |
| Cagle Thomas | -- | -- |
Source: Public Records
Mortgage History
| Date | Status | Borrower | Loan Amount |
|---|---|---|---|
| Open | Atalla Patricia | $295,000 | |
| Previous Owner | Aboulhosn Afif | $380,800 |
Source: Public Records
Tax History Compared to Growth
Tax History
| Year | Tax Paid | Tax Assessment Tax Assessment Total Assessment is a certain percentage of the fair market value that is determined by local assessors to be the total taxable value of land and additions on the property. | Land | Improvement |
|---|---|---|---|---|
| 2025 | $7,994 | $661,007 | $550,293 | $110,714 |
| 2024 | $7,994 | $648,047 | $539,503 | $108,544 |
| 2023 | $7,817 | $635,341 | $528,925 | $106,416 |
| 2022 | $7,609 | $622,884 | $518,554 | $104,330 |
| 2021 | $7,557 | $610,672 | $508,387 | $102,285 |
| 2020 | $7,466 | $604,412 | $503,175 | $101,237 |
| 2019 | $7,333 | $592,561 | $493,309 | $99,252 |
| 2018 | $6,856 | $580,943 | $483,637 | $97,306 |
| 2017 | $81 | $569,553 | $474,154 | $95,399 |
| 2016 | $6,587 | $558,386 | $464,857 | $93,529 |
| 2015 | $6,490 | $550,000 | $457,875 | $92,125 |
| 2014 | $4,746 | $400,000 | $333,000 | $67,000 |
Source: Public Records
Map
Nearby Homes
- 4182 Seri St
- 4380 Rolfe Rd
- 4203 Tolowa St
- 4576 Onondaga Ave
- 4472 Mount Lindsey Ave
- 4226 Mount Voss Dr
- 3701 Tavara Cir
- 3582 Hatteras Ave
- 4527 Chinook Ct
- 4527 Kickapoo Ct
- 4772 Mount Gaywas Dr
- 4150 Taos Dr
- 3476 Ogalala Ave
- 4851 Cole St Unit 1
- 4695 Mount Armet Dr
- 4501 Bannock Ave
- 4915 Mount Gaywas Dr
- 4543 Moraga Ave
- 4401-3 Clairemont Mesa Blvd
- 4875 Cole St Unit 69