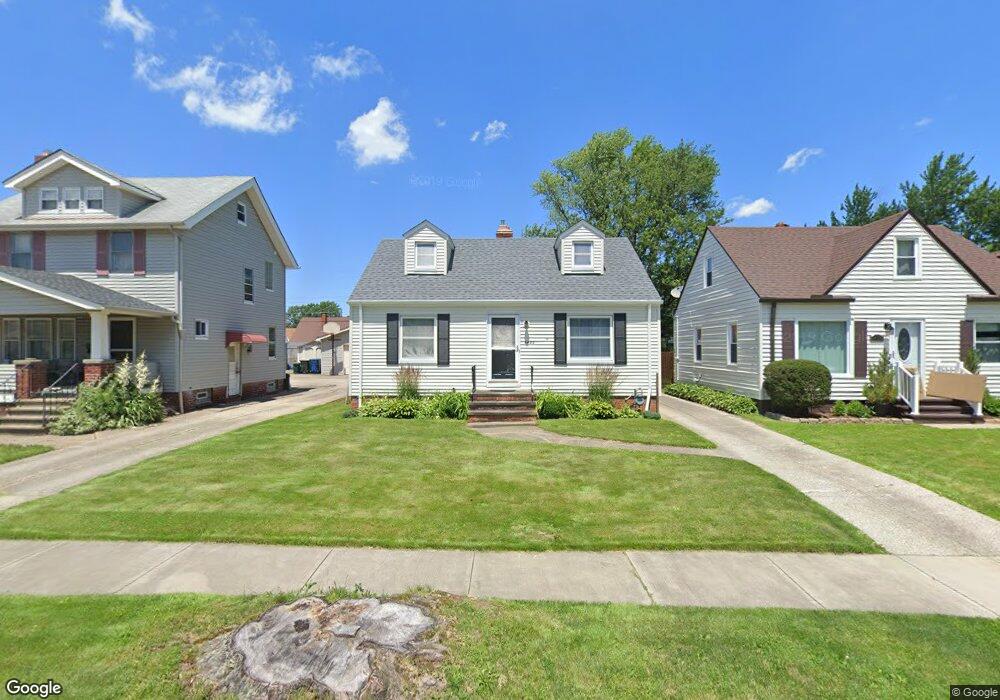
4422 Maplecrest Ave Cleveland, OH 44134
Estimated Value: $157,000 - $215,000
3
Beds
2
Baths
1,250
Sq Ft
$145/Sq Ft
Est. Value
About This Home
This home is located at 4422 Maplecrest Ave, Cleveland, OH 44134 and is currently estimated at $181,212, approximately $144 per square foot. 4422 Maplecrest Ave is a home located in Cuyahoga County with nearby schools including Shiloh Middle School, Thoreau Park Elementary School, and Parma High School.
Ownership History
Date
Name
Owned For
Owner Type
Purchase Details
Closed on
Jun 30, 2004
Sold by
Buffa Brett and Buffa Emily
Bought by
Leiby Adam G
Current Estimated Value
Home Financials for this Owner
Home Financials are based on the most recent Mortgage that was taken out on this home.
Original Mortgage
$104,500
Outstanding Balance
$52,718
Interest Rate
6.37%
Mortgage Type
Purchase Money Mortgage
Estimated Equity
$128,494
Purchase Details
Closed on
Aug 4, 1998
Sold by
Stettin David A and Gillen Margaret A
Bought by
Buffa Brett
Home Financials for this Owner
Home Financials are based on the most recent Mortgage that was taken out on this home.
Original Mortgage
$89,900
Interest Rate
7.05%
Purchase Details
Closed on
Jun 25, 1991
Sold by
Cooper Matthew
Bought by
Stettin David A
Purchase Details
Closed on
Jun 15, 1984
Sold by
Sipos Ronald A and Sipos Joann
Bought by
Cooper Matthew
Purchase Details
Closed on
Jan 1, 1975
Bought by
Sipos Ronald A and Sipos Joann
Create a Home Valuation Report for This Property
The Home Valuation Report is an in-depth analysis detailing your home's value as well as a comparison with similar homes in the area
Home Values in the Area
Average Home Value in this Area
Purchase History
| Date | Buyer | Sale Price | Title Company |
|---|---|---|---|
| Leiby Adam G | $123,000 | Cleveland Title Services A | |
| Buffa Brett | $99,900 | Midland Title Security Inc | |
| Stettin David A | $77,000 | -- | |
| Cooper Matthew | $53,000 | -- | |
| Sipos Ronald A | -- | -- |
Source: Public Records
Mortgage History
| Date | Status | Borrower | Loan Amount |
|---|---|---|---|
| Open | Leiby Adam G | $104,500 | |
| Previous Owner | Buffa Brett | $89,900 |
Source: Public Records
Tax History Compared to Growth
Tax History
| Year | Tax Paid | Tax Assessment Tax Assessment Total Assessment is a certain percentage of the fair market value that is determined by local assessors to be the total taxable value of land and additions on the property. | Land | Improvement |
|---|---|---|---|---|
| 2024 | $3,086 | $50,015 | $10,080 | $39,935 |
| 2023 | $2,677 | $37,110 | $8,020 | $29,090 |
| 2022 | $2,651 | $37,100 | $8,020 | $29,090 |
| 2021 | $2,695 | $36,650 | $8,020 | $28,630 |
| 2020 | $2,363 | $28,180 | $6,160 | $22,020 |
| 2019 | $2,258 | $80,500 | $17,600 | $62,900 |
| 2018 | $2,271 | $28,180 | $6,160 | $22,020 |
| 2017 | $2,178 | $25,170 | $4,830 | $20,340 |
| 2016 | $2,165 | $25,170 | $4,830 | $20,340 |
| 2015 | $2,155 | $25,170 | $4,830 | $20,340 |
| 2014 | $2,155 | $27,060 | $5,180 | $21,880 |
Source: Public Records
Map
Nearby Homes
- 4607 Redfern Rd
- 4424 Forestwood Dr
- 4802 Grantwood Dr
- 3707 Wellington Ave
- 4302 Woodrow Ave
- 4702 Longwood Ave
- 4202 Sheraton Dr
- 4718 Sheraton Dr
- 3436 Heresford Dr
- 3408 Parklane Dr
- 6189 W 54th St
- 5603 Allanwood Dr
- 3325 Commonwealth Dr
- 3314 Commonwealth Dr
- 4206 Liggett Dr
- 3226 Woodlawn Dr
- 3205 George Ave
- 5610 Warwick Dr
- 3218 Somia Dr
- 5714 Alber Ave
- 4418 Maplecrest Ave
- 4426 Maplecrest Ave
- 4414 Maplecrest Ave
- 4430 Maplecrest Ave
- 4410 Maplecrest Ave
- 4423 Redfern Rd
- 4436 Maplecrest Ave
- 4427 Redfern Rd
- 4419 Redfern Rd
- 4431 Redfern Rd
- 4415 Redfern Rd
- 4406 Maplecrest Ave
- 4438 Maplecrest Ave
- 4435 Redfern Rd
- 4427 Maplecrest Ave
- 4411 Redfern Rd
- 4419 Maplecrest Ave
- 4429 Maplecrest Ave
- 4415 Maplecrest Ave
- 4431 Maplecrest Ave