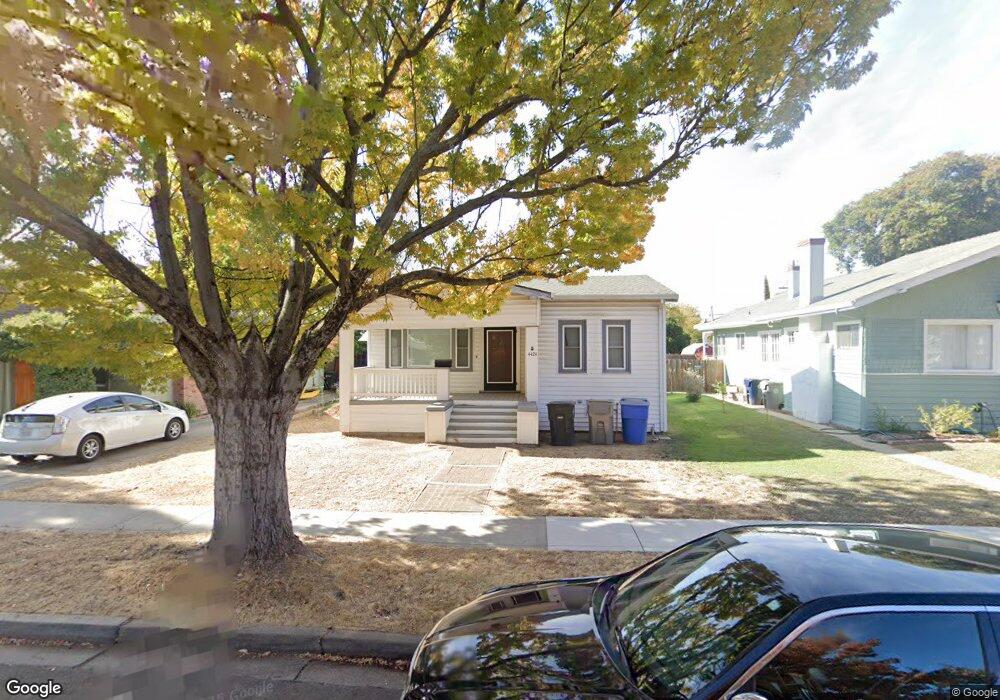
4424 53rd St Sacramento, CA 95820
Colonial Heights NeighborhoodEstimated Value: $288,000 - $438,000
2
Beds
1
Bath
1,158
Sq Ft
$326/Sq Ft
Est. Value
About This Home
This home is located at 4424 53rd St, Sacramento, CA 95820 and is currently estimated at $377,776, approximately $326 per square foot. 4424 53rd St is a home located in Sacramento County with nearby schools including Mark Twain Elementary School, Umoja International Academy, and Hiram W. Johnson High School.
Ownership History
Date
Name
Owned For
Owner Type
Purchase Details
Closed on
Mar 4, 2020
Sold by
Delperdang La Vonne A
Bought by
Brown Tracy
Current Estimated Value
Home Financials for this Owner
Home Financials are based on the most recent Mortgage that was taken out on this home.
Original Mortgage
$203,700
Outstanding Balance
$179,204
Interest Rate
3.6%
Mortgage Type
New Conventional
Estimated Equity
$198,572
Purchase Details
Closed on
May 31, 2019
Sold by
Delperdang La Vonne A
Bought by
Delperdang La Vonne A and 53Rd Street Revocable Trust
Create a Home Valuation Report for This Property
The Home Valuation Report is an in-depth analysis detailing your home's value as well as a comparison with similar homes in the area
Home Values in the Area
Average Home Value in this Area
Purchase History
| Date | Buyer | Sale Price | Title Company |
|---|---|---|---|
| Brown Tracy | $210,000 | Orange Coast Ttl Co Of Nocal | |
| Delperdang La Vonne A | -- | None Available |
Source: Public Records
Mortgage History
| Date | Status | Borrower | Loan Amount |
|---|---|---|---|
| Open | Brown Tracy | $203,700 |
Source: Public Records
Tax History
| Year | Tax Paid | Tax Assessment Tax Assessment Total Assessment is a certain percentage of the fair market value that is determined by local assessors to be the total taxable value of land and additions on the property. | Land | Improvement |
|---|---|---|---|---|
| 2025 | $3,089 | $257,002 | $125,767 | $131,235 |
| 2024 | $3,089 | $251,963 | $123,301 | $128,662 |
| 2023 | $3,016 | $247,024 | $120,884 | $126,140 |
| 2022 | $2,967 | $242,181 | $118,514 | $123,667 |
| 2021 | $2,828 | $237,434 | $116,191 | $121,243 |
| 2020 | $1,111 | $82,367 | $19,868 | $62,499 |
| 2019 | $1,008 | $80,753 | $19,479 | $61,274 |
| 2018 | $981 | $79,171 | $19,098 | $60,073 |
| 2017 | $964 | $77,620 | $18,724 | $58,896 |
| 2016 | $912 | $76,099 | $18,357 | $57,742 |
| 2015 | $894 | $74,957 | $18,082 | $56,875 |
| 2014 | $870 | $73,489 | $17,728 | $55,761 |
Source: Public Records
Map
Nearby Homes
Your Personal Tour Guide
Ask me questions while you tour the home.