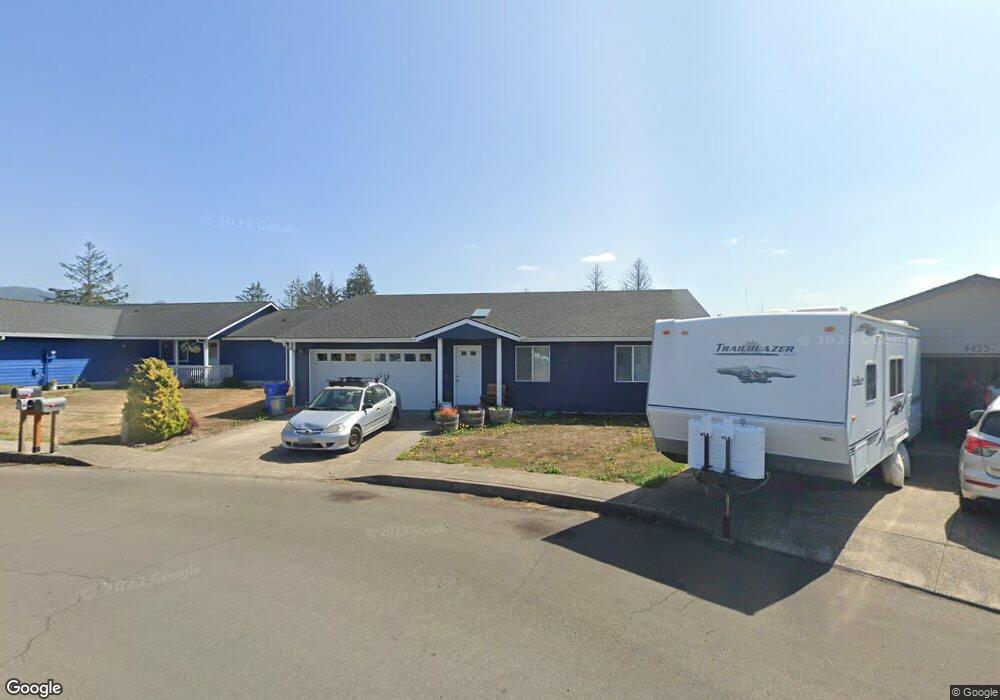
4425 Glenview Ave Tillamook, OR 97141
Estimated Value: $382,000 - $441,000
3
Beds
2
Baths
1,480
Sq Ft
$274/Sq Ft
Est. Value
About This Home
This home is located at 4425 Glenview Ave, Tillamook, OR 97141 and is currently estimated at $405,784, approximately $274 per square foot. 4425 Glenview Ave is a home with nearby schools including Tillamook High School, Tillamook Adventist School, and Little Clipper Preschool.
Ownership History
Date
Name
Owned For
Owner Type
Purchase Details
Closed on
Oct 12, 2021
Sold by
Franke Martin Garth and Franke Rachel Rose
Bought by
Lawonn Matthew J and Reynolds Dana M
Current Estimated Value
Home Financials for this Owner
Home Financials are based on the most recent Mortgage that was taken out on this home.
Original Mortgage
$288,000
Outstanding Balance
$262,629
Interest Rate
2.8%
Mortgage Type
New Conventional
Estimated Equity
$143,155
Purchase Details
Closed on
May 1, 2015
Sold by
Hart Ryan E and Hart Renee M
Bought by
Franke Martin Garth and Franke Rachel Rose
Purchase Details
Closed on
Jan 20, 2012
Sold by
Cross Ken and Cross Bonnie
Bought by
Hart Ryan E and Hart Renee M
Home Financials for this Owner
Home Financials are based on the most recent Mortgage that was taken out on this home.
Original Mortgage
$183,808
Interest Rate
3.93%
Mortgage Type
VA
Purchase Details
Closed on
Aug 18, 2010
Sold by
Girt Richard W and Girt Janice
Bought by
Cross Ken and Cross Bonnie
Create a Home Valuation Report for This Property
The Home Valuation Report is an in-depth analysis detailing your home's value as well as a comparison with similar homes in the area
Home Values in the Area
Average Home Value in this Area
Purchase History
| Date | Buyer | Sale Price | Title Company |
|---|---|---|---|
| Lawonn Matthew J | $360,000 | First American Title | |
| Franke Martin Garth | $195,000 | First American | |
| Hart Ryan E | $179,500 | First American | |
| Cross Ken | $27,000 | First American |
Source: Public Records
Mortgage History
| Date | Status | Borrower | Loan Amount |
|---|---|---|---|
| Open | Lawonn Matthew J | $288,000 | |
| Previous Owner | Hart Ryan E | $183,808 |
Source: Public Records
Tax History Compared to Growth
Tax History
| Year | Tax Paid | Tax Assessment Tax Assessment Total Assessment is a certain percentage of the fair market value that is determined by local assessors to be the total taxable value of land and additions on the property. | Land | Improvement |
|---|---|---|---|---|
| 2024 | $2,175 | $181,790 | $55,970 | $125,820 |
| 2023 | $2,155 | $176,500 | $54,330 | $122,170 |
| 2022 | $2,081 | $171,360 | $52,740 | $118,620 |
| 2021 | $2,019 | $166,370 | $51,210 | $115,160 |
| 2020 | $1,964 | $161,530 | $49,720 | $111,810 |
| 2019 | $1,908 | $156,830 | $48,270 | $108,560 |
| 2018 | $1,859 | $152,270 | $46,870 | $105,400 |
| 2017 | $1,812 | $147,839 | $45,509 | $102,330 |
| 2016 | $1,744 | $143,540 | $44,180 | $99,360 |
| 2015 | $1,709 | $139,360 | $42,890 | $96,470 |
| 2014 | $1,680 | $135,310 | $41,640 | $93,670 |
| 2013 | -- | $131,370 | $40,430 | $90,940 |
Source: Public Records
Map
Nearby Homes
- V/L Marolf Loop Rd
- 4205 Ginkgo Ave
- 4009 Filbert St
- 1110 Meadow Ave
- 4004 Elmwood St
- 00 Schild Rd
- 00 Schild Rd Unit 201
- 3607 3rd St
- 3602 Walnut Ln
- 3413 Maple Ln
- 903 Evergreen Dr
- 0 12th St Unit 2405
- TL#02600 12th St
- 2506 1st St
- 0 Valley View Dr Unit 24275744
- 2418 1st St
- Parcel 1 Wilson River Hwy
- Parcel 2 Wilson River Hwy
- 500 etc. Wilson River Hwy
- 00201 Wilson River Hwy
- Lot 15 Brookfield Meadows
- 4427 Glenview Ave
- 4423 Glenview Ave
- 4421 Glenview Ave
- 4426 Glenview Ave
- 4429 Glenview Ave
- 4419 Glenview Ave
- 4418 Glenview Ave
- 4430 Glenview Ave
- 4431 Glenview Ave
- 4419 Faircrest Dr
- 4417 Glenview Ave
- 4416 Glenview Ave
- 4417 Faircrest Dr
- 4433 Glenview Ave
- 4415 Glenview Ave
- 4414 Glenview Ave
- 4436 Glenview Ave
- Lot 44 Brookfield Meadows
- 4415 Faircrest Dr