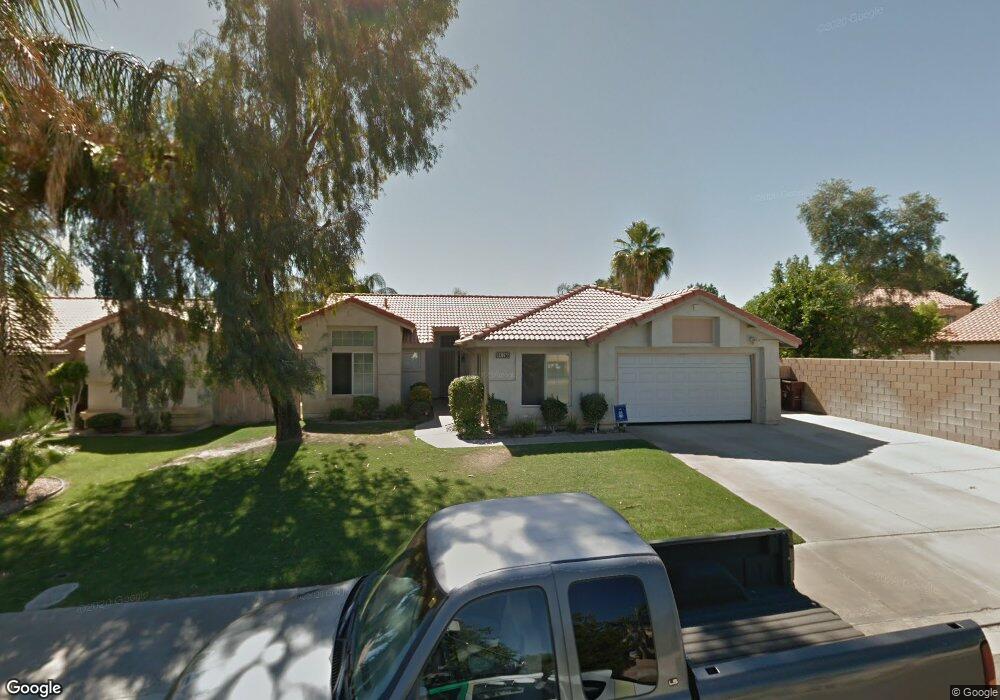
44265 Las Vistas Dr La Quinta, CA 92253
Estimated Value: $402,000 - $665,000
4
Beds
3
Baths
2,010
Sq Ft
$284/Sq Ft
Est. Value
About This Home
This home is located at 44265 Las Vistas Dr, La Quinta, CA 92253 and is currently estimated at $571,439, approximately $284 per square foot. 44265 Las Vistas Dr is a home located in Riverside County with nearby schools including Gerald R. Ford Elementary School, John Glenn Middle School Of International Studies, and La Quinta High School.
Ownership History
Date
Name
Owned For
Owner Type
Purchase Details
Closed on
Feb 10, 2016
Sold by
Rodriguez Robert A and Rodriguez Sheryl L
Bought by
Robert A Anc Sheryl L Rodriguez 2016
Current Estimated Value
Purchase Details
Closed on
Jun 3, 1999
Sold by
Vidlak Karl and Vidlak Karel
Bought by
Rodriguez Robert A and Rodriguez Sheryl L
Home Financials for this Owner
Home Financials are based on the most recent Mortgage that was taken out on this home.
Original Mortgage
$134,800
Interest Rate
7.64%
Purchase Details
Closed on
Jan 27, 1996
Sold by
Vidlak Karl and Vidlak Eva
Bought by
Vidlak Karl
Purchase Details
Closed on
Aug 9, 1993
Sold by
Ctb Associates Lp
Bought by
Vidlak Karel and Vidlak Eva
Home Financials for this Owner
Home Financials are based on the most recent Mortgage that was taken out on this home.
Original Mortgage
$115,100
Interest Rate
7.13%
Create a Home Valuation Report for This Property
The Home Valuation Report is an in-depth analysis detailing your home's value as well as a comparison with similar homes in the area
Home Values in the Area
Average Home Value in this Area
Purchase History
| Date | Buyer | Sale Price | Title Company |
|---|---|---|---|
| Robert A Anc Sheryl L Rodriguez 2016 | -- | None Available | |
| Rodriguez Robert A | -- | None Available | |
| Rodriguez Robert A | $168,500 | Old Republic Title Company | |
| Vidlak Karl | -- | -- | |
| Vidlak Karel | $144,000 | Stewart Title Company |
Source: Public Records
Mortgage History
| Date | Status | Borrower | Loan Amount |
|---|---|---|---|
| Previous Owner | Rodriguez Robert A | $134,800 | |
| Previous Owner | Vidlak Karel | $115,100 | |
| Closed | Rodriguez Robert A | $16,850 |
Source: Public Records
Tax History Compared to Growth
Tax History
| Year | Tax Paid | Tax Assessment Tax Assessment Total Assessment is a certain percentage of the fair market value that is determined by local assessors to be the total taxable value of land and additions on the property. | Land | Improvement |
|---|---|---|---|---|
| 2025 | $4,356 | $299,948 | $64,728 | $235,220 |
| 2023 | $4,356 | $288,302 | $62,215 | $226,087 |
| 2022 | $4,075 | $282,650 | $60,996 | $221,654 |
| 2021 | $3,972 | $277,108 | $59,800 | $217,308 |
| 2020 | $3,902 | $274,267 | $59,187 | $215,080 |
| 2019 | $3,824 | $268,890 | $58,027 | $210,863 |
| 2018 | $3,742 | $263,619 | $56,891 | $206,728 |
| 2017 | $3,680 | $258,451 | $55,776 | $202,675 |
| 2016 | $3,607 | $253,384 | $54,683 | $198,701 |
| 2015 | $3,617 | $249,579 | $53,862 | $195,717 |
| 2014 | $3,562 | $244,692 | $52,808 | $191,884 |
Source: Public Records
Map
Nearby Homes
- 78755 Villeta Dr
- 78487 Magenta Dr
- 78379 Terra Cotta Ct Unit 109
- 78373 Terra Cotta Ct Unit 106
- 78363 Terra Cotta Ct
- 78670 Bradford Cir
- 78440 Via Palomino
- 78347 Scarlet Ct
- 78347 Terra Cotta Ct
- 78640 Alden Cir
- 78860 Zenith Way
- 78524 San Marino Ct
- 44865 Via Alondra
- 44830 Via Mirabel
- 43875 Milan Ct
- 79140 Fred Waring Dr
- 78229 Indigo Dr
- 44520 Via Terra Nova
- 78209 Indigo Dr
- 78199 Indigo Dr
- 44295 Las Vistas Dr
- 78665 Villeta Dr
- 78675 Villeta Dr
- 44325 Las Vistas Dr
- 44350 Villeta Dr
- 78655 Villeta Dr
- 78705 Villeta Dr
- 44340 Villeta Dr
- 44355 Las Vistas Dr
- 78645 Villeta Dr
- 44370 Villeta Dr
- 78720 La Palma Dr
- 44330 Villeta Dr
- 78715 Villeta Dr
- 44385 Las Vistas Dr
- 44400 Villeta Dr
- 78705 La Palma Dr
- 78670 Villeta Dr
- 44320 Villeta Dr
- 78730 La Palma Dr