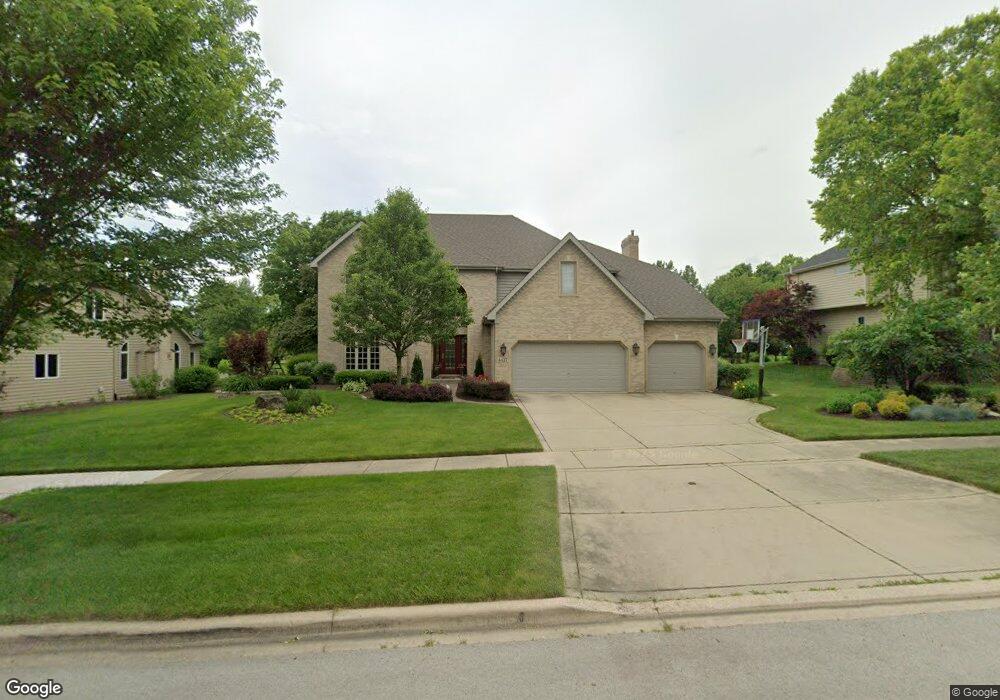
4427 Clearwater Ln Naperville, IL 60564
River Run NeighborhoodEstimated Value: $923,000 - $988,000
--
Bed
1
Bath
4,262
Sq Ft
$224/Sq Ft
Est. Value
About This Home
This home is located at 4427 Clearwater Ln, Naperville, IL 60564 and is currently estimated at $954,176, approximately $223 per square foot. 4427 Clearwater Ln is a home located in Will County with nearby schools including Graham Elementary School, Ellsworth Elementary School, and Clifford Crone Middle School.
Ownership History
Date
Name
Owned For
Owner Type
Purchase Details
Closed on
Mar 4, 2019
Sold by
Keckler Teresa E
Bought by
Keckler Teresa E and Teresa E Keckler Living Trust
Current Estimated Value
Purchase Details
Closed on
Oct 12, 2018
Sold by
Keckler Kenneth P
Bought by
Keckler Teresa E
Purchase Details
Closed on
Dec 30, 1999
Sold by
Sherman James L and Sherman Jennifer M
Bought by
Keckler Kenneth P and Keckler Teresa E
Home Financials for this Owner
Home Financials are based on the most recent Mortgage that was taken out on this home.
Original Mortgage
$160,000
Interest Rate
7.81%
Purchase Details
Closed on
Jul 14, 1995
Sold by
Amber Custom Homes Ltd
Bought by
Sherman James L and Sherman Jennifer M
Home Financials for this Owner
Home Financials are based on the most recent Mortgage that was taken out on this home.
Original Mortgage
$100,000
Interest Rate
7.12%
Purchase Details
Closed on
Feb 16, 1995
Sold by
Oliver Hoffmann Corp
Bought by
Amber Custom Homes Ltd
Create a Home Valuation Report for This Property
The Home Valuation Report is an in-depth analysis detailing your home's value as well as a comparison with similar homes in the area
Home Values in the Area
Average Home Value in this Area
Purchase History
| Date | Buyer | Sale Price | Title Company |
|---|---|---|---|
| Keckler Teresa E | -- | Attorney | |
| Keckler Teresa E | -- | Attorney | |
| Keckler Kenneth P | $531,000 | Law Title Pick Up | |
| Sherman James L | $365,000 | -- | |
| Amber Custom Homes Ltd | $85,000 | Chicago Title Insurance Co |
Source: Public Records
Mortgage History
| Date | Status | Borrower | Loan Amount |
|---|---|---|---|
| Closed | Keckler Kenneth P | $160,000 | |
| Previous Owner | Sherman James L | $100,000 |
Source: Public Records
Tax History Compared to Growth
Tax History
| Year | Tax Paid | Tax Assessment Tax Assessment Total Assessment is a certain percentage of the fair market value that is determined by local assessors to be the total taxable value of land and additions on the property. | Land | Improvement |
|---|---|---|---|---|
| 2024 | $18,968 | $297,592 | $60,808 | $236,784 |
| 2023 | $18,968 | $262,890 | $53,717 | $209,173 |
| 2022 | $17,228 | $243,787 | $50,815 | $192,972 |
| 2021 | $16,475 | $232,178 | $48,395 | $183,783 |
| 2020 | $16,165 | $228,499 | $47,628 | $180,871 |
| 2019 | $15,893 | $222,060 | $46,286 | $175,774 |
| 2018 | $16,024 | $219,907 | $45,268 | $174,639 |
| 2017 | $15,784 | $214,230 | $44,099 | $170,131 |
| 2016 | $15,759 | $209,619 | $43,150 | $166,469 |
| 2015 | $16,543 | $201,556 | $41,490 | $160,066 |
| 2014 | $16,543 | $207,108 | $41,490 | $165,618 |
| 2013 | $16,543 | $207,108 | $41,490 | $165,618 |
Source: Public Records
Map
Nearby Homes
- 1736 Robert Ln
- 1804 Princess Cir
- 2255 Wendt Cir
- 1112 Saratoga Ct
- 3816 Rosada Dr
- 3616 Eliot Ln
- 4007 Heron Ct Unit 1
- 620 Redtop Way
- 1987 Baldwin Way
- 29W316 Andermann Dr
- 620 Switchgrass Way Unit 61006
- 2339 Ryegrass Ln Unit 64005
- 2335 Ryegrass Ln Unit 64004
- 668 Switchgrass Way Unit 58004
- 2711 Wait Rd
- 688 Switchgrass Way Unit 57003
- 596 Redtop Way
- 2241 Bent Grass Way
- 592 Redtop Way
- 588 Redtop Way
- 4503 Clearwater Ln
- 4423 Clearwater Ln
- 4323 Camelot Cir
- 4327 Camelot Cir
- 4419 Clearwater Ln Unit 2
- 4319 Camelot Cir Unit 1
- 4463 Esquire Cir Unit 2
- 4424 Clearwater Ln
- 4415 Clearwater Ln
- 4420 Clearwater Ln
- 4331 Camelot Cir
- 4315 Camelot Cir
- 4460 Esquire Cir
- 4459 Esquire Cir
- 4324 Camelot Cir
- 4416 Clearwater Ln
- 4311 Camelot Cir
- 1635 Dublin Dr
- 4320 Camelot Cir
- 4335 Camelot Cir