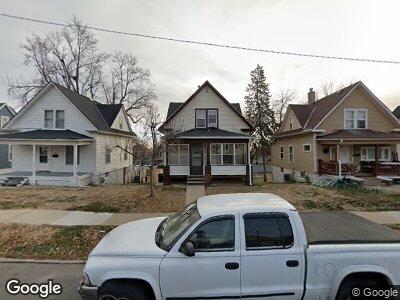
4429 S 20th St Omaha, NE 68107
South Central Omaha NeighborhoodEstimated Value: $147,640 - $180,000
2
Beds
1
Bath
1,032
Sq Ft
$163/Sq Ft
Est. Value
About This Home
This home is located at 4429 S 20th St, Omaha, NE 68107 and is currently estimated at $168,160, approximately $162 per square foot. 4429 S 20th St is a home located in Douglas County with nearby schools including Spring Lake Magnet Center, R.M. Marrs Magnet Middle School, and South High School.
Ownership History
Date
Name
Owned For
Owner Type
Purchase Details
Closed on
Nov 16, 2015
Sold by
Semin Dolores M
Bought by
Flores Braulio
Current Estimated Value
Home Financials for this Owner
Home Financials are based on the most recent Mortgage that was taken out on this home.
Original Mortgage
$80,000
Outstanding Balance
$65,082
Interest Rate
3.85%
Mortgage Type
Commercial
Purchase Details
Closed on
Jul 6, 2015
Sold by
Gonzalez Miquel and Gonzalez Martha
Bought by
Semin Dolores M
Create a Home Valuation Report for This Property
The Home Valuation Report is an in-depth analysis detailing your home's value as well as a comparison with similar homes in the area
Home Values in the Area
Average Home Value in this Area
Purchase History
| Date | Buyer | Sale Price | Title Company |
|---|---|---|---|
| Flores Braulio | $85,000 | None Available | |
| Semin Dolores M | $25,000 | None Available |
Source: Public Records
Mortgage History
| Date | Status | Borrower | Loan Amount |
|---|---|---|---|
| Open | Flores Braulio | $80,000 | |
| Previous Owner | Gonzalez Miguel | $74,968 |
Source: Public Records
Tax History Compared to Growth
Tax History
| Year | Tax Paid | Tax Assessment Tax Assessment Total Assessment is a certain percentage of the fair market value that is determined by local assessors to be the total taxable value of land and additions on the property. | Land | Improvement |
|---|---|---|---|---|
| 2023 | $2,209 | $104,700 | $14,500 | $90,200 |
| 2022 | $2,205 | $103,300 | $13,100 | $90,200 |
| 2021 | $1,873 | $88,500 | $13,100 | $75,400 |
| 2020 | $1,679 | $78,400 | $6,900 | $71,500 |
| 2019 | $1,452 | $67,600 | $5,800 | $61,800 |
| 2018 | $1,331 | $61,900 | $5,800 | $56,100 |
| 2017 | $1,338 | $61,900 | $5,800 | $56,100 |
| 2016 | $1,328 | $61,900 | $5,800 | $56,100 |
| 2015 | $1,310 | $61,900 | $5,800 | $56,100 |
| 2014 | $1,310 | $61,900 | $5,800 | $56,100 |
Source: Public Records
Map
Nearby Homes