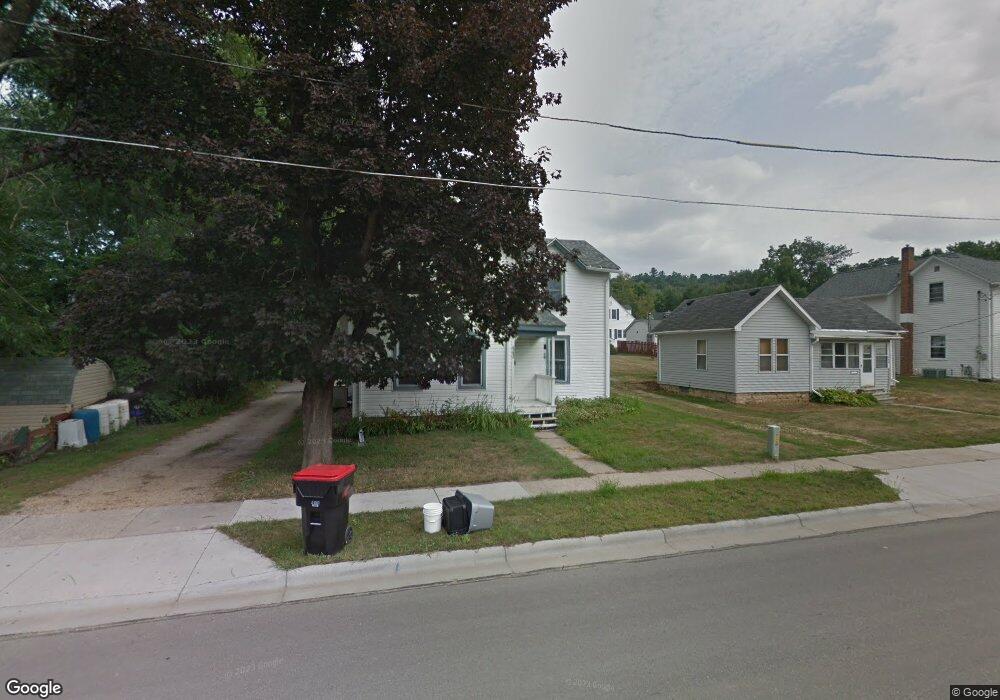
443 13th St Red Wing, MN 55066
Estimated Value: $188,000 - $261,000
5
Beds
1
Bath
1,736
Sq Ft
$129/Sq Ft
Est. Value
About This Home
This home is located at 443 13th St, Red Wing, MN 55066 and is currently estimated at $223,350, approximately $128 per square foot. 443 13th St is a home located in Goodhue County with nearby schools including Sunnyside Elementary School, Burnside Elementary School, and Twin Bluff Middle School.
Ownership History
Date
Name
Owned For
Owner Type
Purchase Details
Closed on
Sep 21, 2018
Sold by
Furlong Scott
Bought by
Furlong David
Current Estimated Value
Purchase Details
Closed on
Nov 25, 2013
Sold by
Furlong David T
Bought by
Furlong Scott J
Purchase Details
Closed on
Feb 21, 2002
Sold by
Signal Bank South N A
Bought by
Furlong David T
Create a Home Valuation Report for This Property
The Home Valuation Report is an in-depth analysis detailing your home's value as well as a comparison with similar homes in the area
Home Values in the Area
Average Home Value in this Area
Purchase History
| Date | Buyer | Sale Price | Title Company |
|---|---|---|---|
| Furlong David | -- | -- | |
| Furlong Scott J | $127,832 | -- | |
| Furlong David T | $75,900 | -- |
Source: Public Records
Mortgage History
| Date | Status | Borrower | Loan Amount |
|---|---|---|---|
| Closed | Furlong David T | -- |
Source: Public Records
Tax History
| Year | Tax Paid | Tax Assessment Tax Assessment Total Assessment is a certain percentage of the fair market value that is determined by local assessors to be the total taxable value of land and additions on the property. | Land | Improvement |
|---|---|---|---|---|
| 2025 | $2,978 | $174,400 | $36,800 | $137,600 |
| 2024 | -- | $171,700 | $36,800 | $134,900 |
| 2023 | $2,910 | $162,600 | $36,800 | $125,800 |
| 2022 | $2,844 | $161,700 | $36,800 | $124,900 |
| 2021 | $2,734 | $140,000 | $36,800 | $103,200 |
| 2020 | $2,758 | $132,100 | $36,800 | $95,300 |
| 2019 | $2,752 | $122,600 | $36,800 | $85,800 |
| 2018 | $2,728 | $121,500 | $35,300 | $86,200 |
| 2017 | $1,558 | $107,700 | $35,300 | $72,400 |
| 2016 | $1,438 | $106,700 | $35,300 | $71,400 |
| 2015 | $1,396 | $103,200 | $35,300 | $67,900 |
| 2014 | -- | $99,400 | $35,300 | $64,100 |
Source: Public Records
Map
Nearby Homes
- 1218 East Ave
- 1547 Bush St
- 1315 12th St
- 759 Plum St
- 418 8th St
- XXXX Skyline Heights
- 1003 Central Ave
- 528 20th St
- 402 W 7th St
- 320 W 7th St
- 814 Central Ave
- 1218 Central Ave
- 613 Potter St
- 121 W 6th St
- 103 W 6th St
- 225 E 5th St
- 1050 Sturtevant St
- 222 Bush St Unit 402
- 222 Bush St Unit 302
- 222 Bush St Unit 404
Your Personal Tour Guide
Ask me questions while you tour the home.