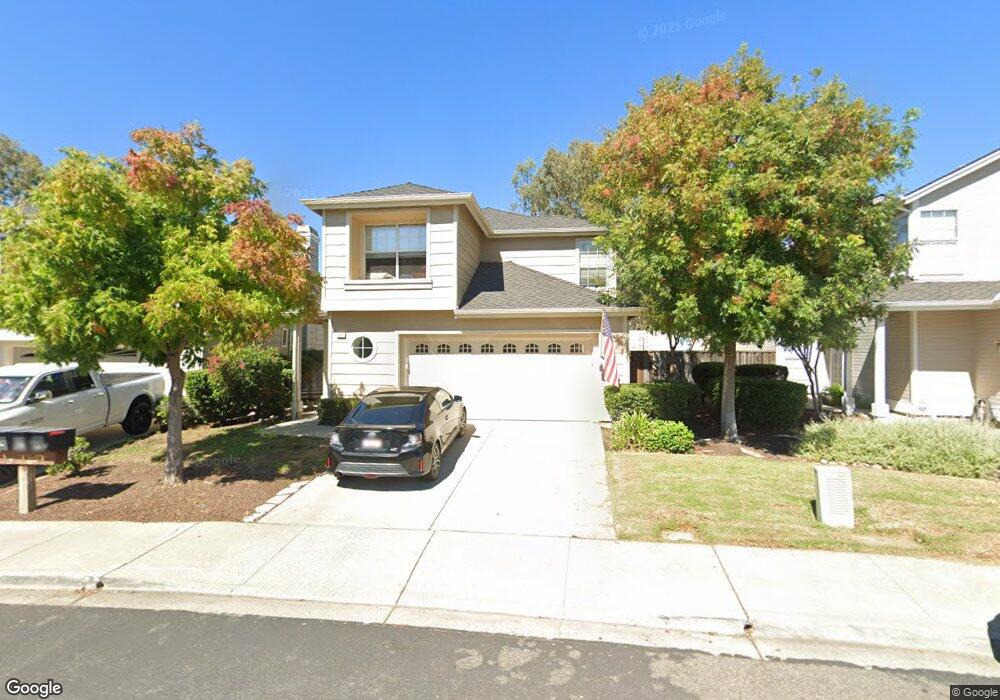
443 Orchard View Ave Martinez, CA 94553
Morello NeighborhoodEstimated Value: $832,852 - $939,000
3
Beds
3
Baths
1,803
Sq Ft
$494/Sq Ft
Est. Value
About This Home
This home is located at 443 Orchard View Ave, Martinez, CA 94553 and is currently estimated at $891,463, approximately $494 per square foot. 443 Orchard View Ave is a home located in Contra Costa County with nearby schools including Morello Park Elementary School, Martinez Junior High School, and Alhambra Senior High School.
Ownership History
Date
Name
Owned For
Owner Type
Purchase Details
Closed on
Oct 26, 2011
Sold by
Campbell Jean L and Fields Jean Campbell
Bought by
Campbell Jean L
Current Estimated Value
Home Financials for this Owner
Home Financials are based on the most recent Mortgage that was taken out on this home.
Original Mortgage
$288,000
Outstanding Balance
$196,388
Interest Rate
4.02%
Mortgage Type
New Conventional
Estimated Equity
$695,075
Purchase Details
Closed on
Nov 3, 2009
Sold by
Vedder Steven G
Bought by
Fields Jean Campbell
Home Financials for this Owner
Home Financials are based on the most recent Mortgage that was taken out on this home.
Original Mortgage
$290,000
Interest Rate
4.92%
Mortgage Type
New Conventional
Purchase Details
Closed on
Oct 20, 2009
Sold by
Fields Robert J
Bought by
Fields Jean Campbell
Home Financials for this Owner
Home Financials are based on the most recent Mortgage that was taken out on this home.
Original Mortgage
$290,000
Interest Rate
4.92%
Mortgage Type
New Conventional
Create a Home Valuation Report for This Property
The Home Valuation Report is an in-depth analysis detailing your home's value as well as a comparison with similar homes in the area
Home Values in the Area
Average Home Value in this Area
Purchase History
| Date | Buyer | Sale Price | Title Company |
|---|---|---|---|
| Campbell Jean L | -- | Fidelity National Title Co | |
| Fields Jean Campbell | $440,000 | Old Republic Title Company | |
| Fields Jean Campbell | -- | Old Republic Title Company |
Source: Public Records
Mortgage History
| Date | Status | Borrower | Loan Amount |
|---|---|---|---|
| Open | Campbell Jean L | $288,000 | |
| Closed | Fields Jean Campbell | $290,000 |
Source: Public Records
Tax History
| Year | Tax Paid | Tax Assessment Tax Assessment Total Assessment is a certain percentage of the fair market value that is determined by local assessors to be the total taxable value of land and additions on the property. | Land | Improvement |
|---|---|---|---|---|
| 2025 | $7,794 | $567,947 | $232,338 | $335,609 |
| 2024 | $7,351 | $556,812 | $227,783 | $329,029 |
| 2023 | $7,351 | $545,895 | $223,317 | $322,578 |
| 2022 | $7,168 | $535,192 | $218,939 | $316,253 |
| 2021 | $6,944 | $524,699 | $214,647 | $310,052 |
| 2019 | $6,681 | $509,138 | $208,282 | $300,856 |
| 2018 | $6,490 | $499,156 | $204,199 | $294,957 |
| 2017 | $6,406 | $489,370 | $200,196 | $289,174 |
| 2016 | $5,969 | $479,775 | $196,271 | $283,504 |
| 2015 | $5,927 | $472,569 | $193,323 | $279,246 |
| 2014 | $5,849 | $463,313 | $189,537 | $273,776 |
Source: Public Records
Map
Nearby Homes
- 415 Orchard View Ave
- 326 Liveoak Ct
- 2875 Parkway Dr
- 388 Mill Rd
- 933 Country Run Dr
- 1013 Stoneybrook Dr
- 0 Palm Ave
- 464 Palm Ave
- 2547 Bella Vista Ave
- 2472 Monterey Ave
- 9 Morello Heights Dr
- 2291 Yale St
- 3121 Pine St
- 1423 Hull Ln
- 1014 Veterans Ct
- 34 Midhill Rd
- 701 Center Ave Unit 99
- 2350 W Shell Ave
- 3120 Pacheco Blvd
- 1050 Sierra Ave
- 445 Orchard View Ave
- 441 Orchard View Ave
- 439 Orchard View Ave
- 501 Trailview Cir
- 437 Orchard View Ave
- 436 Orchard View Ave
- 503 Trailview Cir
- 438 Orchard View Ave
- 440 Orchard View Ave
- 435 Orchard View Ave
- 434 Orchard View Ave
- 505 Trailview Cir
- 432 Orchard View Ave
- 504 Trailview Cir
- 433 Orchard View Ave
- 502 Trailview Cir
- 506 Trailview Cir
- 500 Trailview Cir
- 430 Orchard View Ave
- 411 Trailview Cir
Your Personal Tour Guide
Ask me questions while you tour the home.