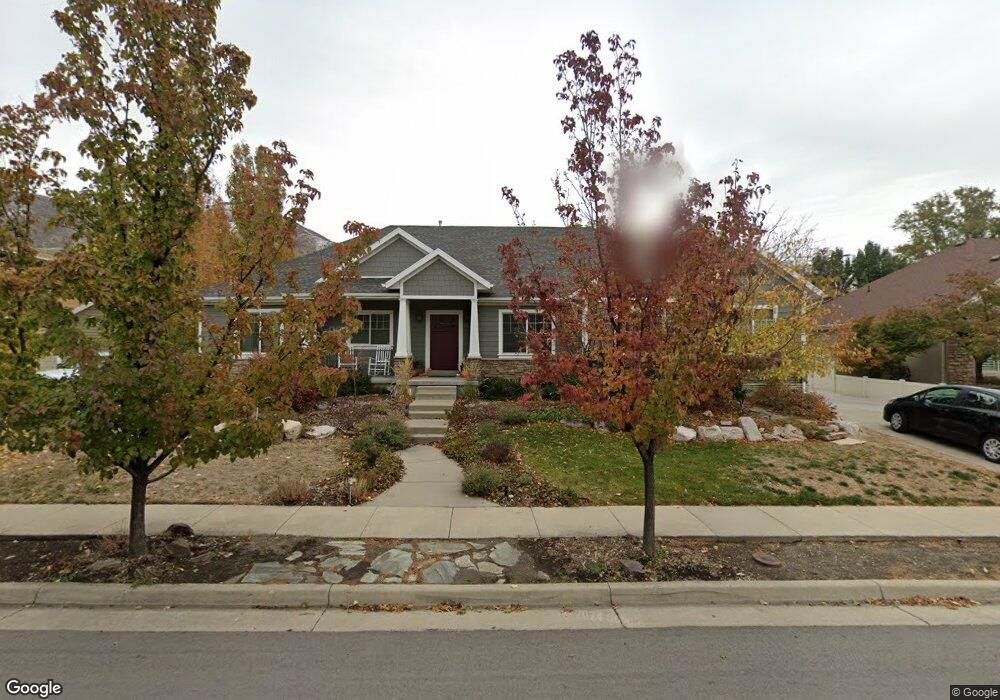
443 S 225 E Centerville, UT 84014
Estimated Value: $608,000 - $746,598
--
Bed
4
Baths
2,000
Sq Ft
$351/Sq Ft
Est. Value
About This Home
This home is located at 443 S 225 E, Centerville, UT 84014 and is currently estimated at $701,150, approximately $350 per square foot. 443 S 225 E is a home located in Davis County with nearby schools including J A Taylor Elementary School, Centerville Jr High, and Viewmont High School.
Ownership History
Date
Name
Owned For
Owner Type
Purchase Details
Closed on
Jun 4, 2012
Sold by
Hawkes Timothy D and Hawkes Rebecca
Bought by
Hawkes Timothy D and Hawkes Rebecca
Current Estimated Value
Home Financials for this Owner
Home Financials are based on the most recent Mortgage that was taken out on this home.
Original Mortgage
$158,000
Outstanding Balance
$109,162
Interest Rate
3.84%
Mortgage Type
New Conventional
Estimated Equity
$591,988
Purchase Details
Closed on
Dec 7, 2004
Sold by
Page James Ronald and Page Tiersa Kai
Bought by
Hawkes Timothy D and Hawkes Rebecca
Create a Home Valuation Report for This Property
The Home Valuation Report is an in-depth analysis detailing your home's value as well as a comparison with similar homes in the area
Purchase History
| Date | Buyer | Sale Price | Title Company |
|---|---|---|---|
| Hawkes Timothy D | -- | Magellan Title | |
| Hawkes Timothy D | -- | Security Title |
Source: Public Records
Mortgage History
| Date | Status | Borrower | Loan Amount |
|---|---|---|---|
| Open | Hawkes Timothy D | $158,000 |
Source: Public Records
Tax History
| Year | Tax Paid | Tax Assessment Tax Assessment Total Assessment is a certain percentage of the fair market value that is determined by local assessors to be the total taxable value of land and additions on the property. | Land | Improvement |
|---|---|---|---|---|
| 2025 | $3,841 | $367,400 | $163,931 | $203,469 |
| 2024 | $3,884 | $377,850 | $147,484 | $230,366 |
| 2023 | $3,880 | $682,000 | $241,740 | $440,260 |
| 2022 | $4,062 | $393,250 | $122,102 | $271,148 |
| 2021 | $3,634 | $548,000 | $186,511 | $361,489 |
| 2020 | $3,157 | $476,000 | $182,119 | $293,881 |
| 2019 | $3,206 | $472,000 | $182,396 | $289,604 |
| 2018 | $2,997 | $436,000 | $169,238 | $266,762 |
| 2016 | $2,599 | $210,100 | $56,837 | $153,263 |
| 2015 | $2,849 | $217,305 | $56,837 | $160,468 |
| 2014 | $2,945 | $225,500 | $56,837 | $168,663 |
| 2013 | -- | $167,601 | $44,204 | $123,397 |
Source: Public Records
Map
Nearby Homes
- 495 E 475 S
- 150 E 735 S Unit 23
- 328 E 1100 S
- 16 W 780 S
- 967 S Courtyard Ln
- 360 E Center St
- 16 S 200 E
- 462 Pitford Dr
- 88 W 50 S Unit C-3
- 88 W 50 S Unit B5
- 610 S 800 E
- 96 Village Square Rd
- 610 E Pages Ln
- 951 Centerville Commons Way
- 330 W Paradiso Ln
- 252 N 400 E
- 56 W 200 N
- 1420 N Main St
- 2 S 285 W
- 204 Lyman Ln
Your Personal Tour Guide
Ask me questions while you tour the home.