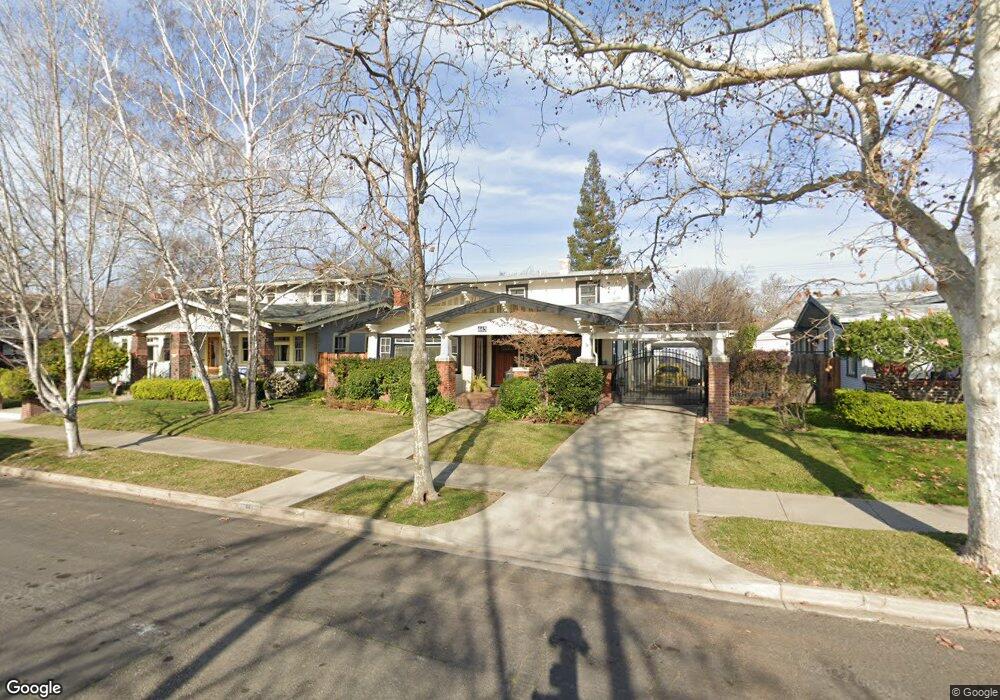
443 S Regent St Stockton, CA 95204
Midtown NeighborhoodEstimated Value: $409,000 - $492,000
3
Beds
2
Baths
1,756
Sq Ft
$259/Sq Ft
Est. Value
About This Home
This home is located at 443 S Regent St, Stockton, CA 95204 and is currently estimated at $454,436, approximately $258 per square foot. 443 S Regent St is a home located in San Joaquin County with nearby schools including El Dorado Elementary School, Wilson Elementary School, and Cleveland Elementary School.
Ownership History
Date
Name
Owned For
Owner Type
Purchase Details
Closed on
May 20, 2020
Sold by
Pafford Ty and Pafford Mary Ann
Bought by
Pafford Ty and Pafford Mary Ann
Current Estimated Value
Home Financials for this Owner
Home Financials are based on the most recent Mortgage that was taken out on this home.
Original Mortgage
$181,000
Outstanding Balance
$126,605
Interest Rate
3.3%
Mortgage Type
New Conventional
Estimated Equity
$327,831
Purchase Details
Closed on
Sep 14, 2011
Sold by
Pafford Ty and Pafford Mary Ann K
Bought by
Pafford Ty and Pafford Mary Ann K
Home Financials for this Owner
Home Financials are based on the most recent Mortgage that was taken out on this home.
Original Mortgage
$207,500
Interest Rate
4.26%
Mortgage Type
New Conventional
Purchase Details
Closed on
Sep 17, 2008
Sold by
Pafford Ty and Pafford Mary Ann K
Bought by
Pafford Ty and Pafford Mary Ann K
Home Financials for this Owner
Home Financials are based on the most recent Mortgage that was taken out on this home.
Original Mortgage
$210,000
Interest Rate
6.43%
Mortgage Type
New Conventional
Purchase Details
Closed on
Jan 9, 2006
Sold by
Pafford Ty and Pafford Mary Ann K
Bought by
Pafford Ty and Pafford Mary Ann K
Home Financials for this Owner
Home Financials are based on the most recent Mortgage that was taken out on this home.
Original Mortgage
$220,000
Interest Rate
6.25%
Mortgage Type
New Conventional
Purchase Details
Closed on
Jul 7, 2005
Sold by
Pafford Ty and Pafford Mary Ann K
Bought by
Pafford Ty and Pafford Mary Ann K
Purchase Details
Closed on
Mar 31, 2000
Sold by
Campigli Jo Ann Marie
Bought by
Pafford Ty and Pafford Maryann
Home Financials for this Owner
Home Financials are based on the most recent Mortgage that was taken out on this home.
Original Mortgage
$159,300
Interest Rate
8.3%
Create a Home Valuation Report for This Property
The Home Valuation Report is an in-depth analysis detailing your home's value as well as a comparison with similar homes in the area
Home Values in the Area
Average Home Value in this Area
Purchase History
| Date | Buyer | Sale Price | Title Company |
|---|---|---|---|
| Pafford Ty | -- | North American Title Co Inc | |
| Pafford Ty | -- | North American Title Co Inc | |
| Pafford Ty | -- | Old Republic Title Company | |
| Pafford Ty | -- | Old Republic Title Company | |
| Pafford Ty | -- | Chicago Title Company | |
| Pafford Ty | -- | Chicago Title Company | |
| Pafford Ty | -- | Chicago Title Co | |
| Pafford Ty | -- | Chicago Title Co | |
| Pafford Ty | -- | -- | |
| Pafford Ty | $177,000 | Chicago Title Co |
Source: Public Records
Mortgage History
| Date | Status | Borrower | Loan Amount |
|---|---|---|---|
| Open | Pafford Ty | $181,000 | |
| Closed | Pafford Ty | $207,500 | |
| Closed | Pafford Ty | $210,000 | |
| Closed | Pafford Ty | $220,000 | |
| Closed | Pafford Ty | $159,300 |
Source: Public Records
Tax History Compared to Growth
Tax History
| Year | Tax Paid | Tax Assessment Tax Assessment Total Assessment is a certain percentage of the fair market value that is determined by local assessors to be the total taxable value of land and additions on the property. | Land | Improvement |
|---|---|---|---|---|
| 2025 | $3,370 | $272,028 | $69,157 | $202,871 |
| 2024 | $3,316 | $266,695 | $67,801 | $198,894 |
| 2023 | $3,242 | $261,467 | $66,472 | $194,995 |
| 2022 | $3,193 | $256,341 | $65,169 | $191,172 |
| 2021 | $3,068 | $251,316 | $63,892 | $187,424 |
| 2020 | $3,128 | $248,740 | $63,237 | $185,503 |
| 2019 | $3,116 | $243,864 | $61,998 | $181,866 |
| 2018 | $3,058 | $239,083 | $60,783 | $178,300 |
| 2017 | $2,897 | $234,396 | $59,592 | $174,804 |
| 2016 | $2,951 | $229,801 | $58,424 | $171,377 |
| 2014 | $2,770 | $219,000 | $66,000 | $153,000 |
Source: Public Records
Map
Nearby Homes
- 423 W Monterey Ave
- 635 N Regent St
- 409 S Central Ave
- 110 W Monterey Ave
- 145 W Mendocino Ave
- 822 W Mariposa Ave
- 674 N Tuxedo Ave
- 520 W Alpine Ave
- 705 S Tuxedo Ave
- 2625 Westminister Ave
- 960 Bristol Ave
- 2820 N El Dorado St
- 815 W Euclid Ave
- 1520 N Commerce St
- 1030 Elmwood Ave
- 1019 S Country Club Blvd
- 144 E Sonoma Ave
- 129 E Sonoma Ave
- 1060 W Monterey Ave
- 27 W Alder St
- 435 S Regent St
- 451 S Regent St
- 450 N Regent St
- 429 S Regent St
- 440 N Regent St
- 460 N Regent St
- 430 N Regent St
- 430 N Regent St
- 456 S Regent St
- 2601 Allston Way
- 448 S Regent St
- 460 S Regent St
- 444 S Regent St
- 2627 Allston Way
- 412 N Regent St
- 404 N Regent St
- 600 S Regent St
- 612 N Regent St
- 612 N Regent St
- 420 S Regent St