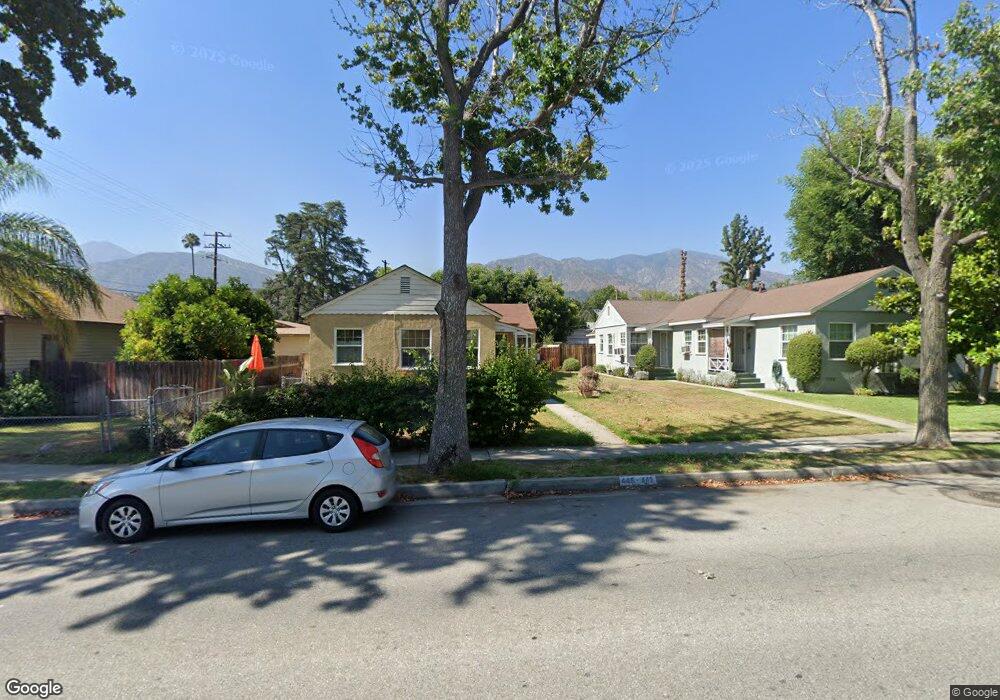
443 W Colorado Blvd Monrovia, CA 91016
Estimated Value: $1,006,000 - $1,161,000
4
Beds
2
Baths
1,500
Sq Ft
$705/Sq Ft
Est. Value
About This Home
This home is located at 443 W Colorado Blvd, Monrovia, CA 91016 and is currently estimated at $1,057,110, approximately $704 per square foot. 443 W Colorado Blvd is a home located in Los Angeles County with nearby schools including Monroe Elementary School, Santa Fe Computer Science Magnet, and Monrovia High School.
Ownership History
Date
Name
Owned For
Owner Type
Purchase Details
Closed on
Jan 4, 2013
Sold by
Lin Yifang
Bought by
Wang Nan Hsun
Current Estimated Value
Purchase Details
Closed on
May 16, 2007
Sold by
Wang Chen Hsiung and Wang Lin Jaw Meei
Bought by
Wang Chen Hsiung
Home Financials for this Owner
Home Financials are based on the most recent Mortgage that was taken out on this home.
Original Mortgage
$400,000
Outstanding Balance
$244,368
Interest Rate
6.25%
Mortgage Type
New Conventional
Estimated Equity
$812,742
Purchase Details
Closed on
May 16, 2006
Sold by
Wang Chen Hsiung and Wang Lin Jaw Meei
Bought by
Wang Chen Hsiung
Purchase Details
Closed on
Aug 16, 1993
Sold by
Wang Chen Hsiung and Wang Lin Jaw Meii
Bought by
Wang Chen Hsiung
Home Financials for this Owner
Home Financials are based on the most recent Mortgage that was taken out on this home.
Original Mortgage
$127,000
Interest Rate
7.16%
Create a Home Valuation Report for This Property
The Home Valuation Report is an in-depth analysis detailing your home's value as well as a comparison with similar homes in the area
Home Values in the Area
Average Home Value in this Area
Purchase History
| Date | Buyer | Sale Price | Title Company |
|---|---|---|---|
| Wang Nan Hsun | -- | Accommodation | |
| Wang Nan Hsun | -- | None Available | |
| Wang Chen Hsiung | -- | Commonwealth Title | |
| Wang Chen Hsiung | -- | Commonwealth Title | |
| Wang Chen Hsiung | -- | None Available | |
| Wang Chen Hsiung | -- | Commonwealth Land Title Comp |
Source: Public Records
Mortgage History
| Date | Status | Borrower | Loan Amount |
|---|---|---|---|
| Open | Wang Chen Hsiung | $400,000 | |
| Closed | Wang Chen Hsiung | $127,000 |
Source: Public Records
Tax History Compared to Growth
Tax History
| Year | Tax Paid | Tax Assessment Tax Assessment Total Assessment is a certain percentage of the fair market value that is determined by local assessors to be the total taxable value of land and additions on the property. | Land | Improvement |
|---|---|---|---|---|
| 2025 | $7,276 | $520,883 | $397,745 | $123,138 |
| 2024 | $7,276 | $510,671 | $389,947 | $120,724 |
| 2023 | $7,112 | $500,658 | $382,301 | $118,357 |
| 2022 | $6,910 | $490,842 | $374,805 | $116,037 |
| 2021 | $6,774 | $481,218 | $367,456 | $113,762 |
| 2019 | $6,461 | $466,947 | $356,558 | $110,389 |
| 2018 | $6,296 | $457,792 | $349,567 | $108,225 |
| 2016 | $6,055 | $440,017 | $335,994 | $104,023 |
| 2015 | $5,925 | $433,409 | $330,948 | $102,461 |
| 2014 | $5,872 | $424,920 | $324,466 | $100,454 |
Source: Public Records
Map
Nearby Homes
- 717 S Magnolia Ave
- 311 W Walnut Ave
- 644 W Colorado Blvd
- 334 Linwood Ave
- 239 W Palm Ave
- 550 W Foothill Blvd Unit C
- 324 Fowler Dr
- 755 W Colorado Blvd
- 267 Linwood Ave Unit E
- 221 Violet Ave Unit A
- 214 Fowler Dr
- 836 W Foothill Blvd Unit A
- 208 Highland Place
- 872 W Walnut Ave Unit A
- 919 W Olive Ave Unit B
- 327 S Lincoln Place Unit 2
- 171 N Sunset Place
- 910 W Foothill Blvd Unit A
- 134 E Cypress Ave
- 307 E Olive Ave
- 439 W Colorado Blvd
- 447 W Colorado Blvd
- 435 W Colorado Blvd
- 512 S Mayflower Ave
- 431 W Colorado Blvd
- 508 S Mayflower Ave
- 501 W Colorado Blvd
- 425 W Colorado Blvd
- 436 W Lemon Ave
- 440 W Lemon Ave
- 521 S Mayflower Ave
- 432 W Lemon Ave
- 502 S Mayflower Ave
- 501 S Mayflower Ave
- 423 W Colorado Blvd
- 511 W Colorado Blvd
- 428 W Lemon Ave
- 601 S Mayflower Ave
- 421 W Colorado Blvd
- 512 W Lemon Ave