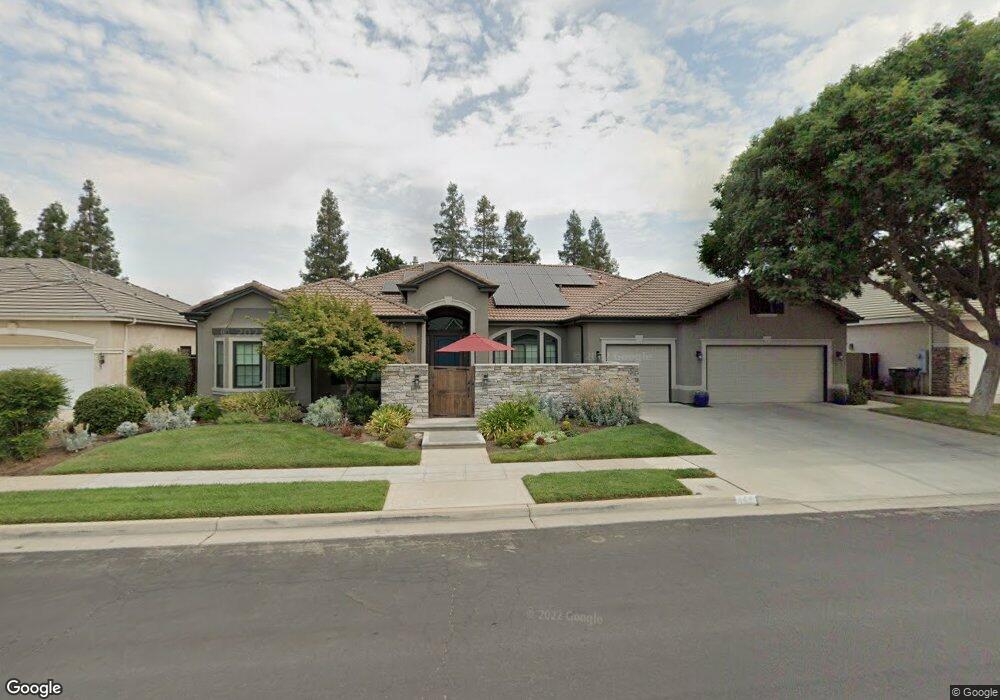
443 W Muncie Ave Clovis, CA 93619
Estimated Value: $805,000 - $979,000
4
Beds
3
Baths
3,290
Sq Ft
$267/Sq Ft
Est. Value
About This Home
This home is located at 443 W Muncie Ave, Clovis, CA 93619 and is currently estimated at $879,278, approximately $267 per square foot. 443 W Muncie Ave is a home located in Fresno County with nearby schools including Garfield Elementary School, Alta Sierra Intermediate School, and Buchanan High School.
Ownership History
Date
Name
Owned For
Owner Type
Purchase Details
Closed on
Sep 20, 2023
Sold by
Monreal Benjamin H and Monreal Leann M
Bought by
Benjamin H Monreal And Leann M Monreal Revoca and Monreal
Current Estimated Value
Home Financials for this Owner
Home Financials are based on the most recent Mortgage that was taken out on this home.
Original Mortgage
$135,000
Outstanding Balance
$132,206
Interest Rate
7.09%
Mortgage Type
Credit Line Revolving
Estimated Equity
$747,072
Purchase Details
Closed on
Jul 13, 1998
Sold by
Wathen Castanos Inc
Bought by
Monreal Benjamin H and Monreal Leann M
Home Financials for this Owner
Home Financials are based on the most recent Mortgage that was taken out on this home.
Original Mortgage
$239,400
Interest Rate
6.78%
Create a Home Valuation Report for This Property
The Home Valuation Report is an in-depth analysis detailing your home's value as well as a comparison with similar homes in the area
Home Values in the Area
Average Home Value in this Area
Purchase History
| Date | Buyer | Sale Price | Title Company |
|---|---|---|---|
| Benjamin H Monreal And Leann M Monreal Revoca | -- | Chicago Title | |
| Monreal Benjamin H | -- | Chicago Title | |
| Monreal Benjamin H | $266,500 | Chicago Title Co |
Source: Public Records
Mortgage History
| Date | Status | Borrower | Loan Amount |
|---|---|---|---|
| Open | Monreal Benjamin H | $135,000 | |
| Previous Owner | Monreal Benjamin H | $239,400 |
Source: Public Records
Tax History
| Year | Tax Paid | Tax Assessment Tax Assessment Total Assessment is a certain percentage of the fair market value that is determined by local assessors to be the total taxable value of land and additions on the property. | Land | Improvement |
|---|---|---|---|---|
| 2025 | $5,447 | $452,535 | $78,374 | $374,161 |
| 2023 | $5,244 | $434,965 | $75,332 | $359,633 |
| 2022 | $5,176 | $426,437 | $73,855 | $352,582 |
| 2021 | $5,012 | $418,076 | $72,407 | $345,669 |
| 2020 | $4,993 | $413,790 | $71,665 | $342,125 |
| 2019 | $4,898 | $405,677 | $70,260 | $335,417 |
| 2018 | $4,793 | $397,724 | $68,883 | $328,841 |
| 2017 | $4,713 | $389,927 | $67,533 | $322,394 |
| 2016 | $4,556 | $382,282 | $66,209 | $316,073 |
| 2015 | $4,487 | $376,541 | $65,215 | $311,326 |
| 2014 | $4,406 | $369,166 | $63,938 | $305,228 |
Source: Public Records
Map
Nearby Homes
- 635 W Quincy Ave
- 1634 N Cindy Ave
- 754 W Riviera Ln
- 290 W Loyola Ave
- 2878 E Omaha Ave
- 717 W Tivoli Ln
- 2776 E Muncie Ave
- 2825 E Quincy Ave
- 2845 E Goshen Ave
- 450 W Alluvial Ave
- 2991 E Cromwell Ave
- 2719 E Spice Way
- 8340 N Shallot Way
- 2707 E Omaha Ave
- 548 W Serena Ave
- 2740 E El Paso Ave
- 77 W Lester Ave
- 334 Vermont Ave
- 8540 N Talladega Way
- 166 Bedford Ave
- 453 W Muncie Ave
- 423 W Muncie Ave
- 446 W Enterprise Ave
- 456 W Enterprise Ave
- 426 W Enterprise Ave
- 473 W Muncie Ave
- 444 W Muncie Ave
- 454 W Muncie Ave
- 424 W Muncie Ave
- 476 W Enterprise Ave
- 1355 N Karen Ave
- 483 W Muncie Ave
- 474 W Muncie Ave
- 486 W Enterprise Ave
- 1375 N Karen Ave
- 414 W Muncie Ave
- 1295 N Terry Ave
- 1345 N Karen Ave
- 441 W Enterprise Ave
- 451 W Enterprise Ave
Your Personal Tour Guide
Ask me questions while you tour the home.