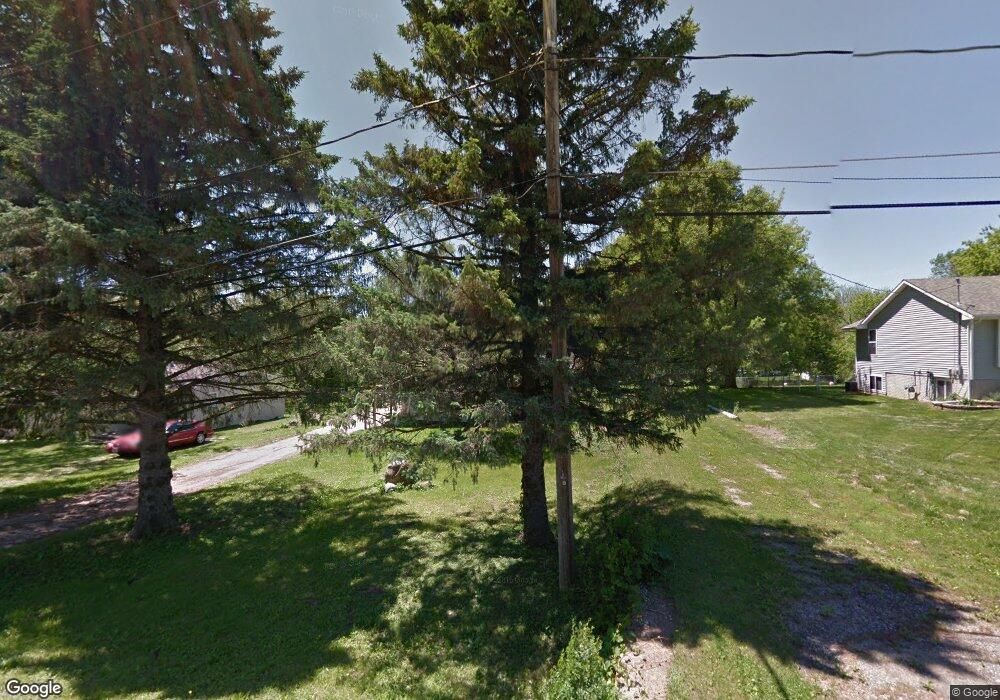
4430 SE 16th St Des Moines, IA 50320
Bloomfield/Allen NeighborhoodEstimated Value: $162,000 - $206,000
3
Beds
1
Bath
1,211
Sq Ft
$158/Sq Ft
Est. Value
About This Home
This home is located at 4430 SE 16th St, Des Moines, IA 50320 and is currently estimated at $191,484, approximately $158 per square foot. 4430 SE 16th St is a home located in Polk County with nearby schools including Jackson Elementary School, Weeks Middle School, and St. Anthony Elementary School.
Ownership History
Date
Name
Owned For
Owner Type
Purchase Details
Closed on
Nov 14, 2005
Sold by
Johnston Michael V
Bought by
Johnston Brian E and Johnston Monica J
Current Estimated Value
Home Financials for this Owner
Home Financials are based on the most recent Mortgage that was taken out on this home.
Original Mortgage
$108,000
Outstanding Balance
$63,012
Interest Rate
7.12%
Mortgage Type
Stand Alone First
Estimated Equity
$128,472
Purchase Details
Closed on
Feb 19, 2003
Sold by
Johnston Brian E and Johnston Monica J
Bought by
Johnston Brian E and Johnston Monica J
Home Financials for this Owner
Home Financials are based on the most recent Mortgage that was taken out on this home.
Original Mortgage
$69,000
Interest Rate
7.75%
Purchase Details
Closed on
Oct 16, 1998
Sold by
Johnston Helen M
Bought by
Johnston Helen M and Johnston Brian E
Create a Home Valuation Report for This Property
The Home Valuation Report is an in-depth analysis detailing your home's value as well as a comparison with similar homes in the area
Home Values in the Area
Average Home Value in this Area
Purchase History
| Date | Buyer | Sale Price | Title Company |
|---|---|---|---|
| Johnston Brian E | -- | Security First Title Co | |
| Johnston Brian E | -- | Security First Title Co | |
| Johnston Brian E | -- | -- | |
| Johnston Helen M | -- | -- |
Source: Public Records
Mortgage History
| Date | Status | Borrower | Loan Amount |
|---|---|---|---|
| Open | Johnston Brian E | $108,000 | |
| Previous Owner | Johnston Brian E | $69,000 |
Source: Public Records
Tax History Compared to Growth
Tax History
| Year | Tax Paid | Tax Assessment Tax Assessment Total Assessment is a certain percentage of the fair market value that is determined by local assessors to be the total taxable value of land and additions on the property. | Land | Improvement |
|---|---|---|---|---|
| 2025 | $2,830 | $174,000 | $41,900 | $132,100 |
| 2024 | $2,830 | $154,300 | $36,700 | $117,600 |
| 2023 | $2,756 | $154,300 | $36,700 | $117,600 |
| 2022 | $2,732 | $125,800 | $30,700 | $95,100 |
| 2021 | $2,546 | $125,800 | $30,700 | $95,100 |
| 2020 | $2,638 | $110,600 | $26,900 | $83,700 |
| 2019 | $2,466 | $110,600 | $26,900 | $83,700 |
| 2018 | $2,436 | $100,300 | $23,900 | $76,400 |
| 2017 | $2,540 | $100,300 | $23,900 | $76,400 |
| 2016 | $4,070 | $102,400 | $33,000 | $69,400 |
| 2015 | $2,468 | $102,400 | $33,000 | $69,400 |
| 2014 | $2,590 | $110,100 | $35,000 | $75,100 |
Source: Public Records
Map
Nearby Homes
- 1201 E Philip St
- 1902 E Marion St
- 3624 SE 18th St
- 1617 Evergreen Ave
- 1600 Evergreen Ave
- 1905 E Maish Ave
- 1843 Evergreen Ave
- 904 E Hackley Ave
- 705 E Watrous Ave
- 3616 SE 11th St
- 3507 SE 18th Ct
- 5205 SE 9th St
- 712 E Hackley Ave
- 801 E Hackley Ave
- 4225 SE 22nd St
- 3506 SE 20th St
- 401 E Mckinley Ave
- 4212 SE 23rd St
- 3406 SE 19th Ct
- 448 Scandia Ave
- 4450 SE 16th St
- 4410 SE 16th St
- 4470 SE 16th St
- 4490 SE 16th St
- 4380 SE 16th St
- 4425 SE 16th St
- 4385 SE 16th St
- 4405 SE 16th St
- 4360 SE 16th St
- 4445 SE 16th St
- 1570 E Emma Ave
- 4520 SE 16th St
- 1560 E Emma Ave
- 1550 E Emma Ave
- 4475 SE 16th St
- 4385 SE 15th Ct
- 1540 E Emma Ave
- 4365 SE 15th Ct
- 4525 SE 16th St
- 4335 SE 16th St