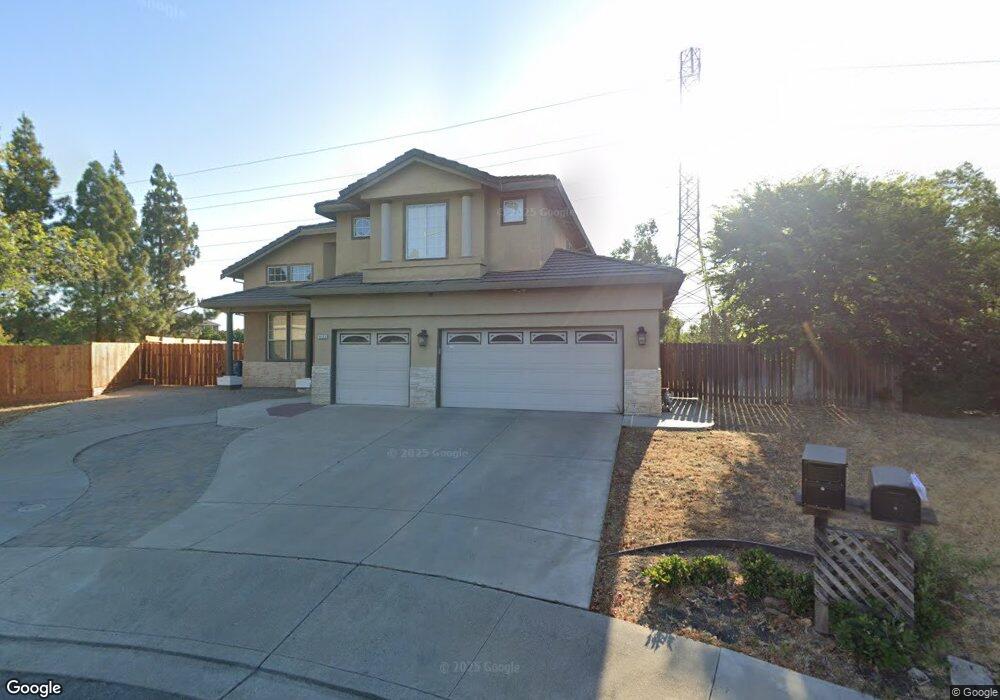
4433 Mare Ct Antioch, CA 94531
Country Hills NeighborhoodEstimated Value: $610,000 - $775,000
4
Beds
3
Baths
2,572
Sq Ft
$269/Sq Ft
Est. Value
About This Home
This home is located at 4433 Mare Ct, Antioch, CA 94531 and is currently estimated at $691,598, approximately $268 per square foot. 4433 Mare Ct is a home located in Contra Costa County with nearby schools including Carmen Dragon Elementary School, Black Diamond Middle School, and Deer Valley High School.
Ownership History
Date
Name
Owned For
Owner Type
Purchase Details
Closed on
Jan 8, 2009
Sold by
U S Bank National Association
Bought by
Tawoke Tesfaye Aleum
Current Estimated Value
Purchase Details
Closed on
Aug 8, 2008
Sold by
Mattie Koland Demetria
Bought by
U S Bank Na
Purchase Details
Closed on
Oct 20, 2006
Sold by
Diversified Ventures Group Llc
Bought by
Mattie Koland Demetria
Home Financials for this Owner
Home Financials are based on the most recent Mortgage that was taken out on this home.
Original Mortgage
$536,000
Interest Rate
6.1%
Mortgage Type
Purchase Money Mortgage
Purchase Details
Closed on
Sep 6, 2006
Sold by
Vera Bernadette and Vera Johnny
Bought by
Diversified Ventures Group Llc
Home Financials for this Owner
Home Financials are based on the most recent Mortgage that was taken out on this home.
Original Mortgage
$536,000
Interest Rate
6.1%
Mortgage Type
Purchase Money Mortgage
Purchase Details
Closed on
Jul 15, 2003
Sold by
Vera Johnny
Bought by
Vera Bernadette
Home Financials for this Owner
Home Financials are based on the most recent Mortgage that was taken out on this home.
Original Mortgage
$324,000
Interest Rate
9%
Mortgage Type
Purchase Money Mortgage
Purchase Details
Closed on
Jul 25, 2000
Sold by
Dosanjh Lakhbir S and Dosanjh Nimrat
Bought by
Vera Johnny
Home Financials for this Owner
Home Financials are based on the most recent Mortgage that was taken out on this home.
Original Mortgage
$248,200
Interest Rate
10.99%
Mortgage Type
Purchase Money Mortgage
Purchase Details
Closed on
Nov 7, 1997
Sold by
Kane Cathleen C and Kane Catherine E
Bought by
Dosanjh Lakhbir S and Dosanjh Nimrat
Home Financials for this Owner
Home Financials are based on the most recent Mortgage that was taken out on this home.
Original Mortgage
$178,000
Interest Rate
7.31%
Mortgage Type
Purchase Money Mortgage
Purchase Details
Closed on
Feb 18, 1994
Sold by
Kane Joseph E
Bought by
Kane Catherine E
Home Financials for this Owner
Home Financials are based on the most recent Mortgage that was taken out on this home.
Original Mortgage
$203,150
Interest Rate
3.75%
Mortgage Type
Purchase Money Mortgage
Purchase Details
Closed on
Feb 17, 1994
Sold by
Shea Homes Ltd Partnership
Bought by
Kane Cathleen C
Home Financials for this Owner
Home Financials are based on the most recent Mortgage that was taken out on this home.
Original Mortgage
$203,150
Interest Rate
3.75%
Mortgage Type
Purchase Money Mortgage
Create a Home Valuation Report for This Property
The Home Valuation Report is an in-depth analysis detailing your home's value as well as a comparison with similar homes in the area
Home Values in the Area
Average Home Value in this Area
Purchase History
| Date | Buyer | Sale Price | Title Company |
|---|---|---|---|
| Tawoke Tesfaye Aleum | $240,000 | First American Title Company | |
| U S Bank Na | $342,000 | First American Title | |
| Mattie Koland Demetria | $675,000 | Chicago Title Co | |
| Diversified Ventures Group Llc | $110,000 | First American Title | |
| Vera Bernadette | -- | First American Title | |
| Vera Johnny | $292,000 | Old Republic Title Company | |
| Vera Johnny | -- | Old Republic Title Company | |
| Dosanjh Lakhbir S | $222,500 | Chicago Title Co | |
| Kane Catherine E | -- | First American Title Guarant | |
| Kane Cathleen C | $228,000 | First American Title Co |
Source: Public Records
Mortgage History
| Date | Status | Borrower | Loan Amount |
|---|---|---|---|
| Previous Owner | Mattie Koland Demetria | $536,000 | |
| Previous Owner | Vera Bernadette | $324,000 | |
| Previous Owner | Vera Johnny | $248,200 | |
| Previous Owner | Dosanjh Lakhbir S | $178,000 | |
| Previous Owner | Kane Cathleen C | $203,150 | |
| Closed | Vera Johnny | $5,000 |
Source: Public Records
Tax History
| Year | Tax Paid | Tax Assessment Tax Assessment Total Assessment is a certain percentage of the fair market value that is determined by local assessors to be the total taxable value of land and additions on the property. | Land | Improvement |
|---|---|---|---|---|
| 2025 | $3,842 | $308,915 | $39,396 | $269,519 |
| 2024 | $3,605 | $302,859 | $38,624 | $264,235 |
| 2023 | $3,605 | $296,921 | $37,867 | $259,054 |
| 2022 | $3,552 | $291,100 | $37,125 | $253,975 |
| 2021 | $3,444 | $285,394 | $36,398 | $248,996 |
| 2019 | $3,357 | $276,930 | $35,319 | $241,611 |
| 2018 | $3,230 | $271,501 | $34,627 | $236,874 |
| 2017 | $3,159 | $266,179 | $33,949 | $232,230 |
| 2016 | $3,076 | $260,961 | $33,284 | $227,677 |
| 2015 | $3,381 | $257,043 | $32,785 | $224,258 |
| 2014 | $4,476 | $252,009 | $32,143 | $219,866 |
Source: Public Records
Map
Nearby Homes
- 4790 Hawkins St
- 4651 Shetland Way
- 4924 Stirrup Way
- 4653 Arabian Way
- 5104 Carriage Way
- 736 Temescal Ct
- 5432 Riverview Ln
- 5037 Bronco Ct
- 5121 Rodeo Ct
- 5460 Riverview Ln
- 5440 Riverview Ln
- 5480 Riverview Ln
- 5476 Riverview Ln
- 4560 Union Place
- 4672 Copper Hill Ct
- 4671 Copper Hill Ct
- 5444 Gray Pine Way
- 4804 Lefebvre Way
- 5532 Promontory Way
- 5541 Promontory Way
- 4429 Mare Ct
- 4437 Mare Ct
- 4425 Mare Ct
- 4441 Mare Ct
- 4423 Horseshoe Cir
- 4421 Mare Ct
- 4417 Mare Ct
- 4427 Horseshoe Cir
- 4504 Pony Ct
- 4508 Pony Ct
- 4763 Braemar St
- 4413 Horseshoe Cir
- 4759 Braemar St
- 4767 Braemar St
- 4500 Pony Ct
- 4418 Horseshoe Cir
- 4422 Horseshoe Cir
- 4771 Braemar St
- 4431 Horseshoe Cir
- 4751 Braemar St
Your Personal Tour Guide
Ask me questions while you tour the home.