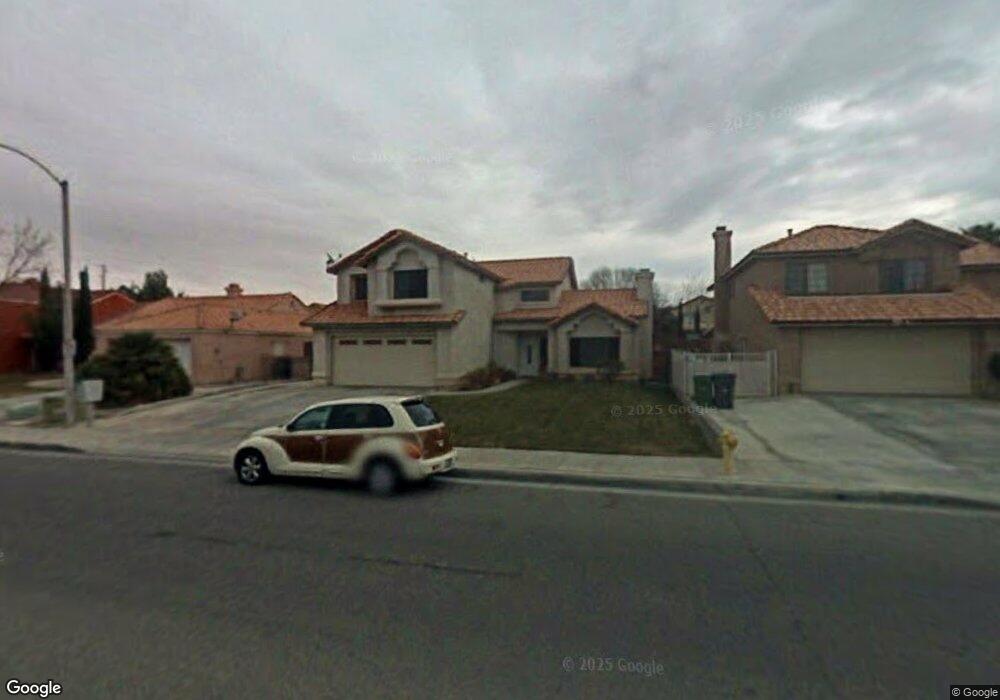
44330 27th St W Lancaster, CA 93536
West Lancaster NeighborhoodEstimated Value: $483,910 - $523,000
4
Beds
3
Baths
1,928
Sq Ft
$264/Sq Ft
Est. Value
About This Home
This home is located at 44330 27th St W, Lancaster, CA 93536 and is currently estimated at $509,228, approximately $264 per square foot. 44330 27th St W is a home located in Los Angeles County with nearby schools including Sunnydale Elementary School, Amargosa Creek Middle School, and Lancaster High School.
Ownership History
Date
Name
Owned For
Owner Type
Purchase Details
Closed on
Apr 8, 1999
Sold by
Va
Bought by
Cohens Cynthia Faye
Current Estimated Value
Home Financials for this Owner
Home Financials are based on the most recent Mortgage that was taken out on this home.
Original Mortgage
$125,899
Outstanding Balance
$32,039
Interest Rate
7.1%
Mortgage Type
Seller Take Back
Estimated Equity
$477,189
Purchase Details
Closed on
Nov 17, 1998
Sold by
Villanea Mario And Indiana Y
Bought by
Va
Purchase Details
Closed on
Jul 26, 1994
Sold by
Federal Home Loan Mortgage Corporation
Bought by
Villanea Mario and Villanea Indiana Y
Home Financials for this Owner
Home Financials are based on the most recent Mortgage that was taken out on this home.
Original Mortgage
$117,300
Interest Rate
8.65%
Mortgage Type
Assumption
Purchase Details
Closed on
Feb 9, 1994
Sold by
Stan Shaw Corp
Bought by
Federal Home Loan Mortgage Corporation
Create a Home Valuation Report for This Property
The Home Valuation Report is an in-depth analysis detailing your home's value as well as a comparison with similar homes in the area
Home Values in the Area
Average Home Value in this Area
Purchase History
| Date | Buyer | Sale Price | Title Company |
|---|---|---|---|
| Cohens Cynthia Faye | $126,000 | First American Title Co | |
| Va | $101,416 | Stewart Title | |
| Villanea Mario | $115,000 | World Title Company | |
| Federal Home Loan Mortgage Corporation | $144,383 | Gateway Title Company |
Source: Public Records
Mortgage History
| Date | Status | Borrower | Loan Amount |
|---|---|---|---|
| Open | Cohens Cynthia Faye | $125,899 | |
| Previous Owner | Villanea Mario | $117,300 |
Source: Public Records
Tax History Compared to Growth
Tax History
| Year | Tax Paid | Tax Assessment Tax Assessment Total Assessment is a certain percentage of the fair market value that is determined by local assessors to be the total taxable value of land and additions on the property. | Land | Improvement |
|---|---|---|---|---|
| 2025 | $3,631 | $197,351 | $39,493 | $157,858 |
| 2024 | $3,631 | $193,482 | $38,719 | $154,763 |
| 2023 | $3,558 | $189,689 | $37,960 | $151,729 |
| 2022 | $3,465 | $185,970 | $37,216 | $148,754 |
| 2021 | $3,072 | $182,325 | $36,487 | $145,838 |
| 2019 | $2,987 | $176,918 | $35,405 | $141,513 |
| 2018 | $2,935 | $173,450 | $34,711 | $138,739 |
| 2016 | $2,862 | $166,716 | $33,364 | $133,352 |
| 2015 | $2,828 | $164,212 | $32,863 | $131,349 |
| 2014 | $2,814 | $160,997 | $32,220 | $128,777 |
Source: Public Records
Map
Nearby Homes
- 44245 Galion Ave
- 44200 Galion Ave
- 2809 Caruso Ln
- 2824 Legends Way
- Vic 125 W Avenue j4
- 44154 Soft Ave
- 44133 28th St W
- 44420 Tarragon Dr
- 2608 W Oldfield St
- 2812 W Oldfield St
- 44454 Tarragon Dr
- 44515 Tarragon Dr
- 44150 30th St W
- 2608 Nice Ct
- 2904 W Avenue j4
- 44154 Planet Cir
- 2528 Key Ct
- 44028 Galion Ave
- 44336 27th St W
- 44324 27th St W
- 44311 Galion Ave
- 44342 27th St W
- 44318 27th St W
- 44317 Galion Ave
- 44307 Galion Ave
- 44323 Galion Ave
- 44301 Galion Ave
- 44310 27th St W
- 44348 27th St W
- 44271 Galion Ave
- 44304 27th St W
- 2629 Macfarlane Dr
- 44356 27th St W
- 44265 Galion Ave
- 44314 Galion Ave
- 44308 Galion Ave
- 44266 27th St W
- 44320 Galion Ave