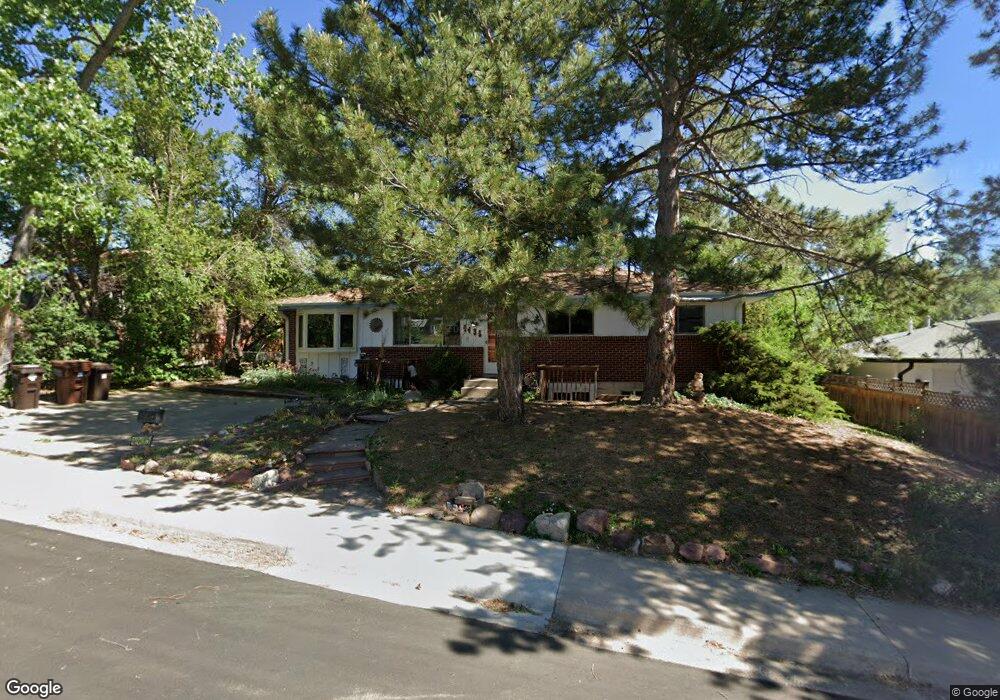
4435 Brookfield Dr Boulder, CO 80305
South Boulder NeighborhoodEstimated Value: $847,000 - $1,014,000
4
Beds
2
Baths
1,323
Sq Ft
$705/Sq Ft
Est. Value
About This Home
This home is located at 4435 Brookfield Dr, Boulder, CO 80305 and is currently estimated at $932,434, approximately $704 per square foot. 4435 Brookfield Dr is a home located in Boulder County with nearby schools including Creekside Elementary School, Southern Hills Middle School, and Fairview High School.
Ownership History
Date
Name
Owned For
Owner Type
Purchase Details
Closed on
Sep 17, 2002
Sold by
Bragg Arthur Hampton and Hays Rebecca
Bought by
Bragg Arthur Hampton
Current Estimated Value
Home Financials for this Owner
Home Financials are based on the most recent Mortgage that was taken out on this home.
Original Mortgage
$195,000
Outstanding Balance
$81,518
Interest Rate
6.25%
Estimated Equity
$850,916
Purchase Details
Closed on
Jan 27, 1994
Sold by
Al Hamoodah Victoria B
Bought by
Bragg Arthur Hampton
Home Financials for this Owner
Home Financials are based on the most recent Mortgage that was taken out on this home.
Original Mortgage
$145,800
Interest Rate
7.1%
Purchase Details
Closed on
Jul 2, 1982
Bought by
Bragg Arthur Hampton and Bragg Rebecca
Purchase Details
Closed on
May 30, 1973
Bought by
Bragg Arthur Hampton and Bragg Rebecca
Create a Home Valuation Report for This Property
The Home Valuation Report is an in-depth analysis detailing your home's value as well as a comparison with similar homes in the area
Home Values in the Area
Average Home Value in this Area
Purchase History
| Date | Buyer | Sale Price | Title Company |
|---|---|---|---|
| Bragg Arthur Hampton | -- | Land Title Guarantee Company | |
| Bragg Arthur Hampton | $153,500 | Stewart Title | |
| Al Hamoodah Victoria B | $500 | Stewart Title | |
| Bragg Arthur Hampton | $79,000 | -- | |
| Bragg Arthur Hampton | $28,000 | -- |
Source: Public Records
Mortgage History
| Date | Status | Borrower | Loan Amount |
|---|---|---|---|
| Open | Bragg Arthur Hampton | $195,000 | |
| Closed | Bragg Arthur Hampton | $145,800 |
Source: Public Records
Tax History
| Year | Tax Paid | Tax Assessment Tax Assessment Total Assessment is a certain percentage of the fair market value that is determined by local assessors to be the total taxable value of land and additions on the property. | Land | Improvement |
|---|---|---|---|---|
| 2025 | $4,855 | $51,356 | $29,431 | $21,925 |
| 2024 | $4,855 | $51,356 | $29,431 | $21,925 |
| 2023 | $4,771 | $55,242 | $34,780 | $24,147 |
| 2022 | $4,219 | $45,432 | $25,896 | $19,536 |
| 2021 | $4,023 | $46,740 | $26,641 | $20,099 |
| 2020 | $3,934 | $45,195 | $25,168 | $20,027 |
| 2019 | $3,874 | $45,195 | $25,168 | $20,027 |
| 2018 | $3,608 | $41,609 | $23,184 | $18,425 |
| 2017 | $3,495 | $46,001 | $25,631 | $20,370 |
| 2016 | $3,163 | $36,537 | $16,159 | $20,378 |
| 2015 | $2,995 | $29,977 | $11,940 | $18,037 |
| 2014 | $2,521 | $29,977 | $11,940 | $18,037 |
Source: Public Records
Map
Nearby Homes
- 4445 Squires Cir
- 725 S 45th St
- 800 W Moorhead Cir Unit E
- 860 W Moorhead Cir Unit 2K
- 860 W Moorhead Cir Unit 1I
- 860 W Moorhead Cir Unit 2H
- 755 W Moorhead Cir Unit B
- 750 W Moorhead Cir Unit A
- 4380 Ludlow St
- 4763 Tantra Dr Unit B
- 4630 MacKy Way
- 450 S 41st St
- 405 S 43rd St
- 4835 Moorhead Ave
- 4286 Greenbriar Blvd
- 3490 Emerson Ave
- 4453 Hamilton Ct
- 4204 Greenbriar Blvd Unit 45
- 3590 Endicott Dr
- 3450 Emerson Ave
- 4400 Brookfield Dr
- 4425 Brookfield Dr
- 4475 Brookfield Dr
- 4440 Whitney Place
- 4400 Whitney Place
- 4480 Whitney Place
- 4385 Brookfield Dr
- 4505 Brookfield Dr
- 4380 Whitney Place
- 4500 Whitney Place
- 4500 Brookfield Dr
- 4555 Brookfield Dr
- 4355 Brookfield Dr
- 4340 Whitney Place
- 4550 Whitney Place
- 4350 Brookfield Dr
- 4550 Brookfield Dr
- 4430 Squires Cir
- 4435 Whitney Place
- 4475 Whitney Place
Your Personal Tour Guide
Ask me questions while you tour the home.