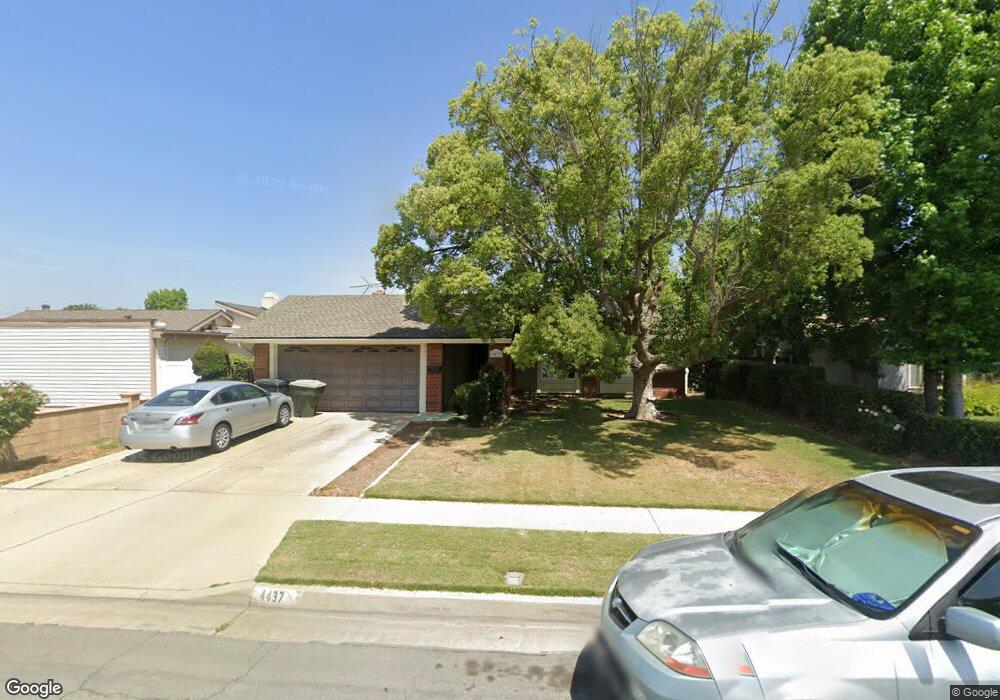
4437 E Lani Ave Anaheim, CA 92807
Anaheim Hills NeighborhoodEstimated Value: $1,009,983 - $1,153,000
4
Beds
2
Baths
1,852
Sq Ft
$584/Sq Ft
Est. Value
About This Home
This home is located at 4437 E Lani Ave, Anaheim, CA 92807 and is currently estimated at $1,081,746, approximately $584 per square foot. 4437 E Lani Ave is a home located in Orange County with nearby schools including Olive Elementary School, Canyon High School, and El Rancho Charter.
Ownership History
Date
Name
Owned For
Owner Type
Purchase Details
Closed on
Jan 1, 2025
Sold by
Revocabl 2001 and Revocabl Christine
Bought by
Welcome Home Properties Llc
Current Estimated Value
Purchase Details
Closed on
Oct 23, 2014
Sold by
Cooper Gary Michael and Cooper Dianne Jeanne
Bought by
The 2001 Mark & Christine Leffler Revoca
Purchase Details
Closed on
Feb 2, 2000
Sold by
Robert Barker and Robert Ann Celia
Bought by
Cooper Gary Michael and Cooper Dianne Jeanne
Home Financials for this Owner
Home Financials are based on the most recent Mortgage that was taken out on this home.
Original Mortgage
$234,650
Interest Rate
6.75%
Purchase Details
Closed on
Aug 10, 1998
Sold by
Robert Barker and Robert Celia Barker
Bought by
Barker Robert G and Barker Celia Ann
Create a Home Valuation Report for This Property
The Home Valuation Report is an in-depth analysis detailing your home's value as well as a comparison with similar homes in the area
Home Values in the Area
Average Home Value in this Area
Purchase History
| Date | Buyer | Sale Price | Title Company |
|---|---|---|---|
| Welcome Home Properties Llc | -- | None Listed On Document | |
| The 2001 Mark & Christine Leffler Revoca | $395,000 | Bnt Title Company | |
| Cooper Gary Michael | $247,000 | Chicago Title Co | |
| Barker Robert G | -- | -- |
Source: Public Records
Mortgage History
| Date | Status | Borrower | Loan Amount |
|---|---|---|---|
| Previous Owner | Cooper Gary Michael | $234,650 |
Source: Public Records
Tax History Compared to Growth
Tax History
| Year | Tax Paid | Tax Assessment Tax Assessment Total Assessment is a certain percentage of the fair market value that is determined by local assessors to be the total taxable value of land and additions on the property. | Land | Improvement |
|---|---|---|---|---|
| 2025 | $7,243 | $661,012 | $531,295 | $129,717 |
| 2024 | $7,243 | $648,051 | $520,877 | $127,174 |
| 2023 | $7,083 | $635,345 | $510,664 | $124,681 |
| 2022 | $6,946 | $622,888 | $500,651 | $122,237 |
| 2021 | $6,752 | $610,675 | $490,834 | $119,841 |
| 2020 | $6,690 | $604,414 | $485,801 | $118,613 |
| 2019 | $6,606 | $592,563 | $476,275 | $116,288 |
| 2018 | $6,506 | $580,945 | $466,937 | $114,008 |
| 2017 | $6,235 | $569,554 | $457,781 | $111,773 |
| 2016 | $6,115 | $558,387 | $448,805 | $109,582 |
| 2015 | $6,036 | $550,000 | $442,064 | $107,936 |
| 2014 | $3,475 | $310,925 | $202,901 | $108,024 |
Source: Public Records
Map
Nearby Homes
- 4433 E Lani Ave
- 408 N Torrens St
- 4809 E Wasatch Dr
- 4864 E Mckinnon Dr
- 5059 E Crescent Dr
- 1952 Avenida Del Sol
- 500 N Tustin Ave Unit 218
- 1963 Via de la Luna
- 1958 Avenida Del Sol
- 1664 Via de la Luna
- 419 N Tustin Ave
- 307 N Tustin Ave
- 1645 La Paloma Ave
- 1712 N Glenview Ave
- 4263 E Ranch Gate Rd
- 451 S Wishing Well Ln
- 4179 N Santa Lucia St
- 1663 Oak St
- 1833 Taft Ln
- 3211 E Mandeville Place
- 4441 E Lani Ave
- 4442 E Alderdale Ave
- 4445 E Lani Ave
- 4438 E Alderdale Ave
- 4429 E Lani Ave
- 4446 E Alderdale Ave
- 411 N Leaf Cir
- 4434 E Alderdale Ave
- 4450 E Alderdale Ave
- 4425 E Lani Ave
- 4449 E Lani Ave
- 410 N Leaf Cir
- 4430 E Alderdale Ave
- 405 N Leaf Cir
- 410 N Deerfield St
- 4454 E Alderdale Ave
- 408 N Leaf Cir
- 404 N Deerfield St
- 4441 E Alderdale Ave
- 4445 E Alderdale Ave