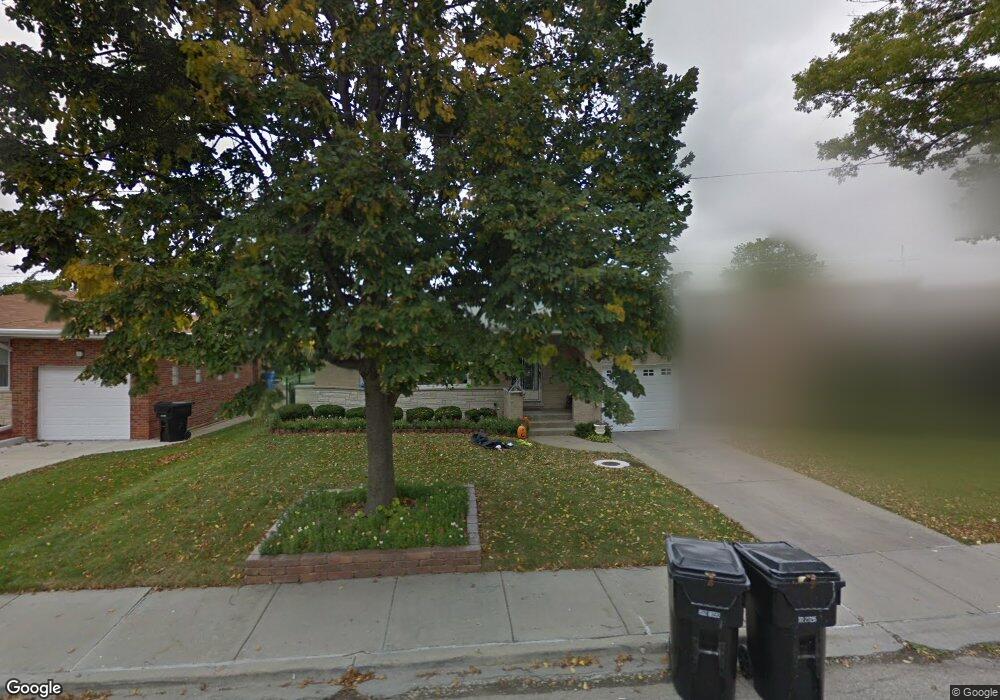
4439 N Forestview Ave Chicago, IL 60656
Schorsch Forest View NeighborhoodEstimated Value: $476,000 - $494,000
3
Beds
1
Bath
1,359
Sq Ft
$357/Sq Ft
Est. Value
About This Home
This home is located at 4439 N Forestview Ave, Chicago, IL 60656 and is currently estimated at $485,655, approximately $357 per square foot. 4439 N Forestview Ave is a home located in Cook County with nearby schools including Dirksen Elementary School, Taft High School, and Brickton Montessori School.
Ownership History
Date
Name
Owned For
Owner Type
Purchase Details
Closed on
Jun 8, 2009
Sold by
Duda John P and Duda Laura M
Bought by
Duda John P and Murray Laura
Current Estimated Value
Home Financials for this Owner
Home Financials are based on the most recent Mortgage that was taken out on this home.
Original Mortgage
$273,500
Outstanding Balance
$173,545
Interest Rate
4.85%
Mortgage Type
New Conventional
Estimated Equity
$312,110
Purchase Details
Closed on
Sep 14, 2006
Sold by
Kisiel John D
Bought by
Duda Laura M and Duda John P
Home Financials for this Owner
Home Financials are based on the most recent Mortgage that was taken out on this home.
Original Mortgage
$280,000
Interest Rate
6.59%
Mortgage Type
Unknown
Purchase Details
Closed on
Dec 20, 1994
Sold by
Pioneer Bank & Trust Company
Bought by
Kisiel Chester J and Kisiel Edna A
Home Financials for this Owner
Home Financials are based on the most recent Mortgage that was taken out on this home.
Original Mortgage
$60,000
Interest Rate
9.23%
Create a Home Valuation Report for This Property
The Home Valuation Report is an in-depth analysis detailing your home's value as well as a comparison with similar homes in the area
Home Values in the Area
Average Home Value in this Area
Purchase History
| Date | Buyer | Sale Price | Title Company |
|---|---|---|---|
| Duda John P | -- | Charter Title Llc | |
| Duda Laura M | $420,000 | Multiple | |
| Kisiel Chester J | $190,000 | -- |
Source: Public Records
Mortgage History
| Date | Status | Borrower | Loan Amount |
|---|---|---|---|
| Open | Duda John P | $273,500 | |
| Closed | Duda Laura M | $280,000 | |
| Previous Owner | Kisiel Chester J | $60,000 |
Source: Public Records
Tax History Compared to Growth
Tax History
| Year | Tax Paid | Tax Assessment Tax Assessment Total Assessment is a certain percentage of the fair market value that is determined by local assessors to be the total taxable value of land and additions on the property. | Land | Improvement |
|---|---|---|---|---|
| 2024 | $6,685 | $37,719 | $15,975 | $21,744 |
| 2023 | $6,495 | $35,000 | $12,780 | $22,220 |
| 2022 | $6,495 | $35,000 | $12,780 | $22,220 |
| 2021 | $6,369 | $35,000 | $12,780 | $22,220 |
| 2020 | $5,774 | $29,020 | $7,987 | $21,033 |
| 2019 | $5,789 | $32,245 | $7,987 | $24,258 |
| 2018 | $6,201 | $34,827 | $7,987 | $26,840 |
| 2017 | $4,952 | $26,378 | $7,029 | $19,349 |
| 2016 | $4,783 | $26,378 | $7,029 | $19,349 |
| 2015 | $4,607 | $27,767 | $7,029 | $20,738 |
| 2014 | $4,600 | $27,359 | $6,390 | $20,969 |
| 2013 | $4,498 | $27,359 | $6,390 | $20,969 |
Source: Public Records
Map
Nearby Homes
- 4456 N Forestview Ave
- 8600 W Brodman Ave
- 8449 W Brodman Ave
- 8434 W Brodman Ave
- 4621 N Anthon Ave
- 4615 N Maria Ct
- 8423 W Wilson Ave
- 4623 N Chester Ave Unit 110W
- 4624 N Commons Dr Unit 405E
- 4624 N Commons Dr Unit 111E
- 4600 N Cumberland Ave Unit 314
- 8255 W Agatite Ave
- 4938 N Leonard Dr Unit 1B
- 8200 W Eastwood Ave
- 8268 W Lawrence Ave
- 8542 W Winnemac Ave
- 5037 N East River Rd Unit 1B
- 3916 N Pontiac Ave
- 8517 W Carmen Ave
- 5117 N East River Rd Unit 1A
- 4433 N Forestview Ave
- 4453 N Forestview Ave
- 4456 N Reserve Ave
- 4452 N Reserve Ave
- 4426 N Potawatomie Ave
- 4426 N Potawatomie St
- 4462 N Reserve Ave
- 4442 N Potawatomie Ave
- 4459 N Forestview Ave
- 4440 N Forestview Ave
- 4436 N Forestview Ave
- 4446 N Forestview Ave
- 4470 N Reserve Ave
- 4430 N Forestview Ave
- 4452 N Forestview Ave
- 4424 N Forestview Ave
- 4465 N Forestview Ave
- 4500 N Reserve Ave
- 4427 N Potawatomie Ave
- 8659 W Brodman Ave