
$99,900
- 3 Beds
- 1.5 Baths
- 1,525 Sq Ft
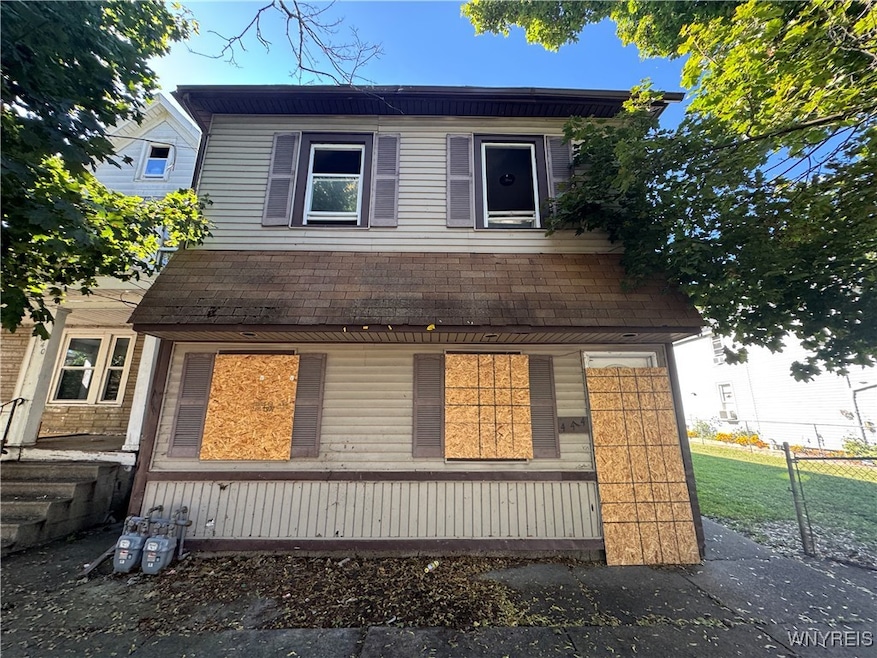
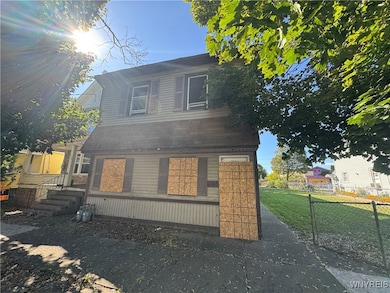
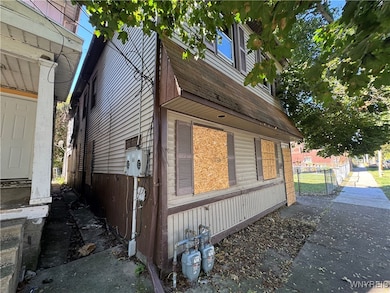
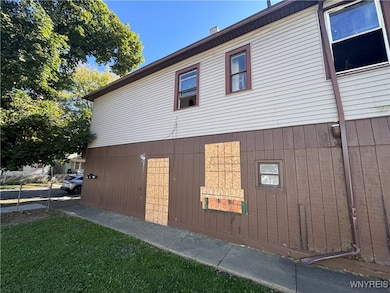
- 1705 Niagara St
- Niagara Falls, NY
Awesome Niagara Falls home with fabulous, paying, clean tenants! 3 bedrooms (with finished attic space used as a 4th), 1.5 bathrooms and a wonderful layout, this home is sure to please. Large yard, back deck, plenty of cabinet space, and big bedrooms. Also, newer furnace and hot water tank. This home is well maintained! A great addition to any investment portfolio. Offers reviewed as they are
Caleb Canazzi Blue Eagle Realty Corp.