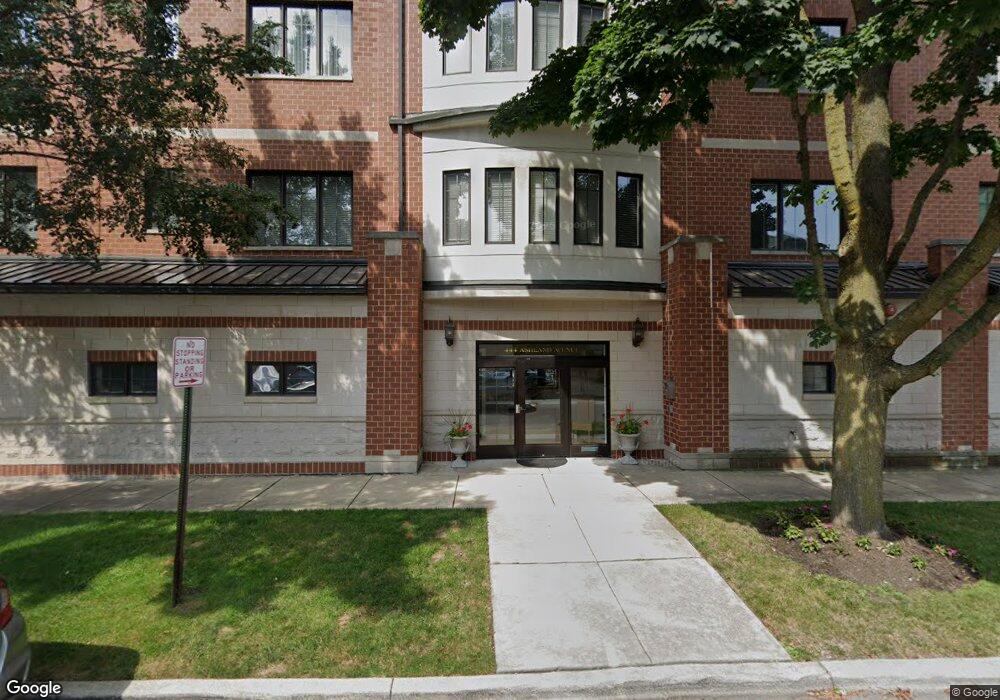
444 Ashland Ave Unit 2S River Forest, IL 60305
Estimated Value: $384,000 - $1,135,000
3
Beds
3
Baths
3,170
Sq Ft
$191/Sq Ft
Est. Value
About This Home
This home is located at 444 Ashland Ave Unit 2S, River Forest, IL 60305 and is currently estimated at $604,437, approximately $190 per square foot. 444 Ashland Ave Unit 2S is a home located in Cook County with nearby schools including Lincoln Elementary School, Roosevelt Middle School, and Oak Park and River Forest High School.
Ownership History
Date
Name
Owned For
Owner Type
Purchase Details
Closed on
Aug 27, 2018
Sold by
Green Richard M
Bought by
Green Richard M and Green Caryn R
Current Estimated Value
Purchase Details
Closed on
Apr 18, 2012
Sold by
Green Richard M
Bought by
Green Richard M and The Richard M Green Revocable Trust
Purchase Details
Closed on
Mar 18, 2009
Sold by
Green Richard M
Bought by
Green Richard M
Purchase Details
Closed on
Apr 27, 2005
Sold by
Declaration Lloyd Nancy Louise
Bought by
Green Richard M
Home Financials for this Owner
Home Financials are based on the most recent Mortgage that was taken out on this home.
Original Mortgage
$574,800
Outstanding Balance
$280,565
Interest Rate
5.25%
Mortgage Type
Fannie Mae Freddie Mac
Estimated Equity
$323,872
Create a Home Valuation Report for This Property
The Home Valuation Report is an in-depth analysis detailing your home's value as well as a comparison with similar homes in the area
Home Values in the Area
Average Home Value in this Area
Purchase History
| Date | Buyer | Sale Price | Title Company |
|---|---|---|---|
| Green Richard M | -- | Attorney | |
| Green Richard M | -- | None Available | |
| Green Richard M | -- | Cti | |
| Green Richard M | $718,500 | Prairie Title |
Source: Public Records
Mortgage History
| Date | Status | Borrower | Loan Amount |
|---|---|---|---|
| Open | Green Richard M | $574,800 |
Source: Public Records
Tax History
| Year | Tax Paid | Tax Assessment Tax Assessment Total Assessment is a certain percentage of the fair market value that is determined by local assessors to be the total taxable value of land and additions on the property. | Land | Improvement |
|---|---|---|---|---|
| 2025 | $7,083 | $31,840 | $1,978 | $29,862 |
| 2024 | $7,083 | $31,840 | $1,978 | $29,862 |
| 2023 | $17,439 | $31,840 | $1,978 | $29,862 |
| 2022 | $17,439 | $60,160 | $3,220 | $56,940 |
| 2021 | $16,845 | $60,160 | $3,220 | $56,940 |
| 2020 | $18,281 | $60,160 | $3,220 | $56,940 |
| 2019 | $18,992 | $61,179 | $2,944 | $58,235 |
| 2018 | $17,980 | $61,179 | $2,944 | $58,235 |
| 2017 | $17,915 | $61,179 | $2,944 | $58,235 |
| 2016 | $15,402 | $47,879 | $2,438 | $45,441 |
| 2015 | $15,131 | $47,879 | $2,438 | $45,441 |
| 2014 | $13,860 | $47,879 | $2,438 | $45,441 |
| 2013 | $17,073 | $60,509 | $2,438 | $58,071 |
Source: Public Records
Map
Nearby Homes
- 411 Ashland Ave Unit 1A
- 411 Ashland Ave Unit 6D
- 424 Park Ave Unit 205
- 424 Park Ave Unit 204
- 424 Park Ave Unit 206
- 502 Park Ave Unit 502
- 7521 Brown Ave Unit G
- 711 Jackson Ave
- 7415 Dixon St
- 7348 Lake St Unit 2E
- 7346 Lake St Unit GW
- 7320 Lake St Unit 1A
- 710 William St
- 210 Des Plaines Ave Unit D
- 510 Bonnie Brae Place Unit K3
- 310 Lathrop Ave Unit P52
- 7449 Washington St Unit 305
- 7449 Washington St Unit 206
- 7443 Washington St Unit 307
- 314 Lathrop Ave Unit 407
- 444 Ashland Ave Unit 3N
- 444 Ashland Ave Unit 3S
- 444 Ashland Ave Unit 4
- 444 Ashland Ave Unit 2N
- 500 Ashland Ave
- 410 Ashland Ave Unit 3E
- 410 Ashland Ave Unit 4E
- 410 Ashland Ave Unit 4A
- 410 Ashland Ave Unit 3D
- 410 Ashland Ave Unit 2E
- 410 Ashland Ave Unit 4D
- 410 Ashland Ave Unit 2C
- 410 Ashland Ave Unit 5F
- 410 Ashland Ave Unit 3B
- 410 Ashland Ave Unit 3A
- 410 Ashland Ave Unit 3G
- 410 Ashland Ave Unit 3F
- 410 Ashland Ave Unit 2D
- 410 Ashland Ave Unit 5B
- 410 Ashland Ave Unit 4F
Your Personal Tour Guide
Ask me questions while you tour the home.