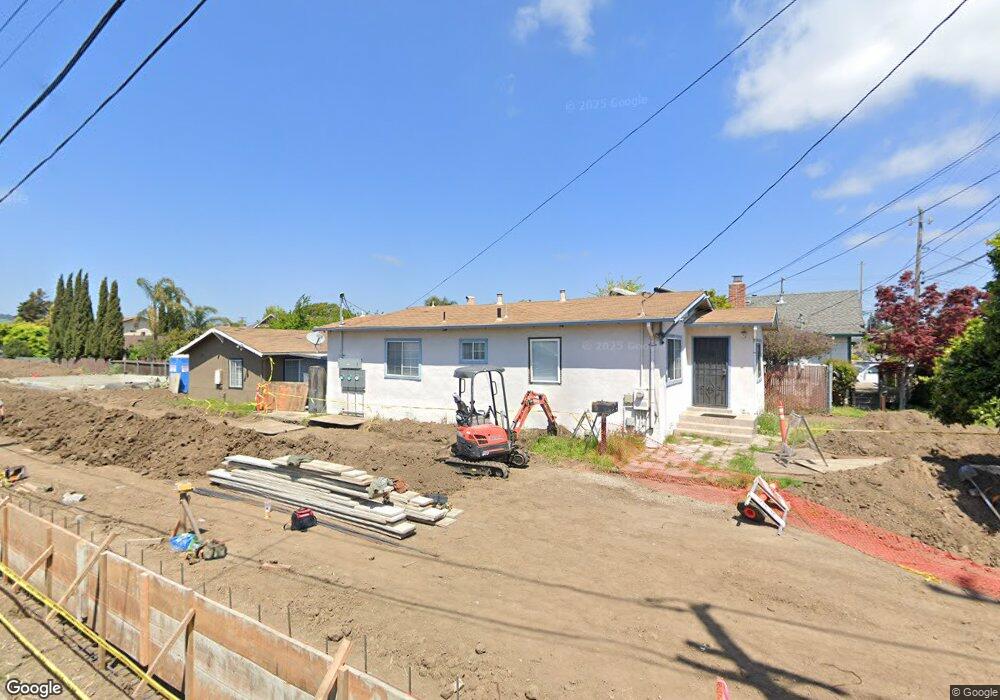
444 Cherry Way Hayward, CA 94541
Estimated Value: $610,000 - $722,068
2
Beds
2
Baths
960
Sq Ft
$706/Sq Ft
Est. Value
About This Home
This home is located at 444 Cherry Way, Hayward, CA 94541 and is currently estimated at $678,017, approximately $706 per square foot. 444 Cherry Way is a home located in Alameda County with nearby schools including Winton Middle School, Hayward High School, and St. John Catholic School.
Ownership History
Date
Name
Owned For
Owner Type
Purchase Details
Closed on
Oct 12, 2021
Sold by
Begum Sharif Halima Sainaz
Bought by
Mohammed Tariq and Sainaz Begum Sharif Halima
Current Estimated Value
Home Financials for this Owner
Home Financials are based on the most recent Mortgage that was taken out on this home.
Original Mortgage
$548,000
Interest Rate
3.11%
Mortgage Type
New Conventional
Purchase Details
Closed on
Feb 25, 2017
Sold by
Sharif Halima Sainaz Begum
Bought by
Sharif Halima Sainaz Begum and The H Sharif Living Trust
Purchase Details
Closed on
Jun 16, 1999
Sold by
Lillian Brittenham Margaret L and Lillian Margaret
Bought by
Sharif Mohammed and Sharif Halima S B
Home Financials for this Owner
Home Financials are based on the most recent Mortgage that was taken out on this home.
Original Mortgage
$150,000
Interest Rate
7.01%
Create a Home Valuation Report for This Property
The Home Valuation Report is an in-depth analysis detailing your home's value as well as a comparison with similar homes in the area
Home Values in the Area
Average Home Value in this Area
Purchase History
| Date | Buyer | Sale Price | Title Company |
|---|---|---|---|
| Mohammed Tariq | $3,490,909 | Servicelink | |
| Sharif Halima Sainaz Begum | -- | Servicelink | |
| Sharif Halima Sainaz Begum | -- | None Available | |
| Sharif Mohammed | $225,000 | First American Title Guarant | |
| Boricchio Margaret Lillian | -- | First American Title Guarant |
Source: Public Records
Mortgage History
| Date | Status | Borrower | Loan Amount |
|---|---|---|---|
| Previous Owner | Mohammed Tariq | $548,000 | |
| Previous Owner | Sharif Mohammed | $150,000 |
Source: Public Records
Tax History
| Year | Tax Paid | Tax Assessment Tax Assessment Total Assessment is a certain percentage of the fair market value that is determined by local assessors to be the total taxable value of land and additions on the property. | Land | Improvement |
|---|---|---|---|---|
| 2025 | $5,433 | $361,258 | $105,814 | $255,444 |
| 2024 | $5,433 | $354,177 | $103,740 | $250,437 |
| 2023 | $5,415 | $347,233 | $101,706 | $245,527 |
| 2022 | $4,849 | $340,425 | $99,712 | $240,713 |
| 2021 | $4,783 | $333,751 | $97,757 | $235,994 |
| 2020 | $4,702 | $330,330 | $96,755 | $233,575 |
| 2019 | $4,714 | $323,854 | $94,858 | $228,996 |
| 2018 | $4,433 | $317,504 | $92,998 | $224,506 |
| 2017 | $4,323 | $311,280 | $91,175 | $220,105 |
| 2016 | $4,069 | $305,178 | $89,388 | $215,790 |
| 2015 | $3,981 | $300,594 | $88,045 | $212,549 |
| 2014 | $3,793 | $294,707 | $86,321 | $208,386 |
Source: Public Records
Map
Nearby Homes
- 20923 Haviland Ave
- 263 Medford Ave
- 595 Blossom Way Unit 10
- 19884 Meekland Ave
- 19539 Meekland Ave
- 10 Leighty Ct Unit 5
- 823 Blossom Way
- 592 Willow Ave
- 18407 Rainier Ave
- 688 Grove Way
- 21806 Meekland Ave
- 188 Sunset Blvd
- 127 Hampton Rd
- 17779 Rainier Ave
- 21492 Montgomery Ave
- 19092 Ricardo Ave
- 20917 Locust St
- 257 Poplar Ave
- 16826 Bar Ave
- 412 Solano Ave
- 460 Cherry Way
- 424 Cherry Way
- 20443 Haviland Ave
- 20463 Haviland Ave
- 20483 Haviland Ave
- 445 Cherry Way
- 461 Cherry Way
- 425 Cherry Way
- 20423 Haviland Ave
- 406 Cherry Way
- 479 Cherry Way
- 407 Cherry Way
- 20381 Haviland Ave
- 497 Cherry Way
- 396 Cherry Way
- 364 Saint George St
- 393 Cherry Way
- 370 Saint George St
- 356 Saint George St
- 20361 Haviland Ave
Your Personal Tour Guide
Ask me questions while you tour the home.