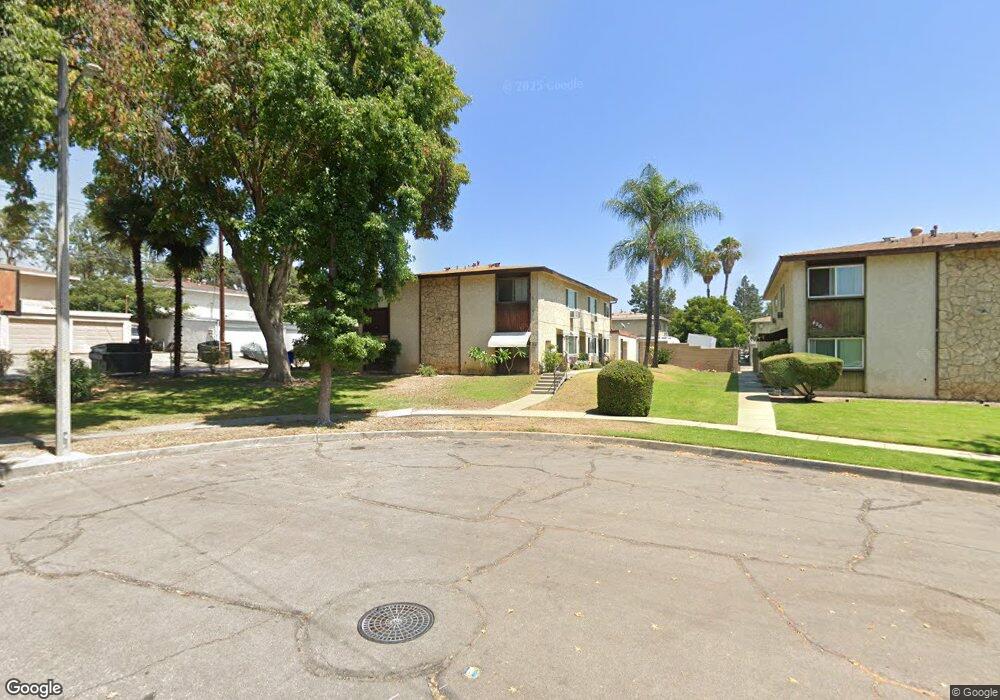
444 Tyler Way Upland, CA 91786
Estimated Value: $1,111,795 - $1,371,000
Studio
4
Baths
4,028
Sq Ft
$299/Sq Ft
Est. Value
About This Home
This home is located at 444 Tyler Way, Upland, CA 91786 and is currently estimated at $1,202,449, approximately $298 per square foot. 444 Tyler Way is a home located in San Bernardino County with nearby schools including Cabrillo Elementary, Upland Junior High School, and Upland High School.
Ownership History
Date
Name
Owned For
Owner Type
Purchase Details
Closed on
Nov 24, 2025
Sold by
Silveira Desmond and Silveira Sarah
Bought by
Xavier Holdings I Llc
Current Estimated Value
Purchase Details
Closed on
Mar 6, 2015
Sold by
Silveira Desmond A
Bought by
Silveira Desmond and Silveira Sarah
Home Financials for this Owner
Home Financials are based on the most recent Mortgage that was taken out on this home.
Original Mortgage
$385,500
Interest Rate
3.54%
Mortgage Type
New Conventional
Purchase Details
Closed on
Dec 13, 2004
Sold by
Parker Sarah Anne
Bought by
Silveira Desmond A
Home Financials for this Owner
Home Financials are based on the most recent Mortgage that was taken out on this home.
Original Mortgage
$443,800
Interest Rate
5.7%
Mortgage Type
New Conventional
Purchase Details
Closed on
Nov 21, 2000
Sold by
Hanten Harold Stephen and Hanten Loretta K
Bought by
Silveira Desmond A
Home Financials for this Owner
Home Financials are based on the most recent Mortgage that was taken out on this home.
Original Mortgage
$264,267
Interest Rate
7.54%
Mortgage Type
FHA
Create a Home Valuation Report for This Property
The Home Valuation Report is an in-depth analysis detailing your home's value as well as a comparison with similar homes in the area
Home Values in the Area
Average Home Value in this Area
Purchase History
| Date | Buyer | Sale Price | Title Company |
|---|---|---|---|
| Xavier Holdings I Llc | -- | None Listed On Document | |
| Silveira Desmond | -- | Spl Title Services | |
| Silveira Desmond A | -- | Stewart Title Company | |
| Silveira Desmond A | $268,000 | American Title |
Source: Public Records
Mortgage History
| Date | Status | Borrower | Loan Amount |
|---|---|---|---|
| Previous Owner | Silveira Desmond | $385,500 | |
| Previous Owner | Silveira Desmond A | $443,800 | |
| Previous Owner | Silveira Desmond A | $264,267 |
Source: Public Records
Tax History
| Year | Tax Paid | Tax Assessment Tax Assessment Total Assessment is a certain percentage of the fair market value that is determined by local assessors to be the total taxable value of land and additions on the property. | Land | Improvement |
|---|---|---|---|---|
| 2025 | $4,556 | $403,840 | $141,344 | $262,496 |
| 2024 | $4,411 | $395,922 | $138,573 | $257,349 |
| 2023 | $4,344 | $388,159 | $135,856 | $252,303 |
| 2022 | $4,323 | $380,548 | $133,192 | $247,356 |
| 2021 | $4,244 | $373,086 | $130,580 | $242,506 |
| 2020 | $4,130 | $369,260 | $129,241 | $240,019 |
| 2019 | $4,116 | $362,020 | $126,707 | $235,313 |
| 2018 | $4,017 | $354,922 | $124,223 | $230,699 |
| 2017 | $3,901 | $347,962 | $121,787 | $226,175 |
| 2016 | $3,683 | $341,139 | $119,399 | $221,740 |
| 2015 | $3,599 | $336,015 | $117,606 | $218,409 |
| 2014 | $3,507 | $329,433 | $115,302 | $214,131 |
Source: Public Records
Map
Nearby Homes
- 1339 W 11th St
- 1553 Corte Santana
- 1565 W Arrow Hwy Unit C23
- 1565 W Arrow Hwy Unit spc c-08
- 1565 W Arrow Hwy
- 595 Juniper Ave
- 1328 W 8th St
- 988 W Arrow Hwy Unit E
- 290 Spencer Ave
- 1399 Fredericks Ln
- 1443 Fredericks Ln
- 1487 Florence Ct
- 1018 Shiba Ct
- 960 Sheridan St
- 1423 W 7th St
- 1223 Lenwood Square
- 1885 W 9th St
- 1400 W 13th St Unit 186
- 1400 W 13th St Unit 116
- 1400 W 13th St Unit 142
- 444 Tyler Way Unit D
- 426 Tyler Way
- 1338 W Arrow Hwy
- 1350 W Arrow Hwy
- 1334 W Arrow Hwy
- 406 Tyler Way
- 441 Silverwood Ave
- 1358 W Arrow Hwy
- 431 Silverwood Ave
- 1322 W Arrow Hwy
- 443 Tyler Way Unit A
- 443 Tyler Way
- 433 Tyler Way Unit C
- 433 Tyler Way
- 405 Silverwood Ave
- 1366 W Arrow Hwy Unit A
- 1366 W Arrow Hwy
- 1318 W Arrow Hwy
- 405 Tyler Way Unit A
- 405 Tyler Way
Your Personal Tour Guide
Ask me questions while you tour the home.