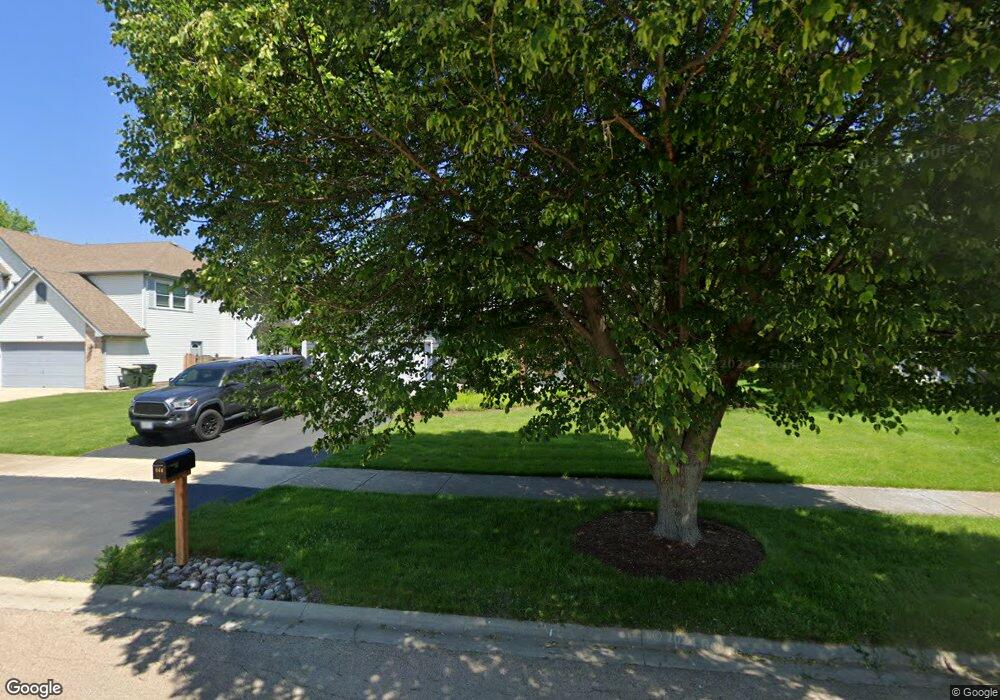
444 Windsor Dr Oswego, IL 60543
South Oswego NeighborhoodEstimated Value: $401,892 - $439,000
3
Beds
3
Baths
1,922
Sq Ft
$221/Sq Ft
Est. Value
About This Home
This home is located at 444 Windsor Dr, Oswego, IL 60543 and is currently estimated at $424,973, approximately $221 per square foot. 444 Windsor Dr is a home located in Kendall County with nearby schools including Prairie Point Elementary School, Traughber Junior High School, and Oswego High School.
Ownership History
Date
Name
Owned For
Owner Type
Purchase Details
Closed on
May 28, 2010
Sold by
Nemeth Bradley S and Nemeth Lisa A
Bought by
Bonesz Zachary T and Bonesz Jennifer M
Current Estimated Value
Home Financials for this Owner
Home Financials are based on the most recent Mortgage that was taken out on this home.
Original Mortgage
$186,120
Outstanding Balance
$125,227
Interest Rate
5.05%
Mortgage Type
New Conventional
Estimated Equity
$299,746
Purchase Details
Closed on
May 1, 2010
Bought by
Bonesz Zachary I and Bonesz Jennifer M
Home Financials for this Owner
Home Financials are based on the most recent Mortgage that was taken out on this home.
Original Mortgage
$186,120
Outstanding Balance
$125,227
Interest Rate
5.05%
Mortgage Type
New Conventional
Estimated Equity
$299,746
Purchase Details
Closed on
Mar 1, 1996
Bought by
Nemeth Bardley S and Nemeth Lisa A
Purchase Details
Closed on
Jun 22, 1995
Bought by
Wohead Steven F
Create a Home Valuation Report for This Property
The Home Valuation Report is an in-depth analysis detailing your home's value as well as a comparison with similar homes in the area
Home Values in the Area
Average Home Value in this Area
Purchase History
| Date | Buyer | Sale Price | Title Company |
|---|---|---|---|
| Bonesz Zachary T | $233,000 | Chicago Title Insurance Co | |
| Bonesz Zachary I | $232,700 | -- | |
| Nemeth Bardley S | $165,000 | -- | |
| Wohead Steven F | $160,000 | -- |
Source: Public Records
Mortgage History
| Date | Status | Borrower | Loan Amount |
|---|---|---|---|
| Open | Bonesz Zachary T | $186,120 | |
| Closed | Wohead Steven F | -- |
Source: Public Records
Tax History
| Year | Tax Paid | Tax Assessment Tax Assessment Total Assessment is a certain percentage of the fair market value that is determined by local assessors to be the total taxable value of land and additions on the property. | Land | Improvement |
|---|---|---|---|---|
| 2024 | $8,702 | $114,130 | $28,486 | $85,644 |
| 2023 | $7,751 | $101,000 | $25,209 | $75,791 |
| 2022 | $7,751 | $91,818 | $22,917 | $68,901 |
| 2021 | $7,469 | $85,811 | $21,418 | $64,393 |
| 2020 | $7,384 | $84,128 | $20,998 | $63,130 |
| 2019 | $6,950 | $78,389 | $20,998 | $57,391 |
| 2018 | $7,161 | $79,350 | $18,948 | $60,402 |
| 2017 | $6,988 | $74,158 | $17,708 | $56,450 |
| 2016 | $6,865 | $71,998 | $17,192 | $54,806 |
| 2015 | $7,045 | $70,586 | $16,855 | $53,731 |
| 2014 | -- | $68,530 | $16,364 | $52,166 |
| 2013 | -- | $68,530 | $16,364 | $52,166 |
Source: Public Records
Map
Nearby Homes
- 483 Deerfield Dr
- 482 Deerfield Dr
- 514 Danbury Dr Unit 4
- 668 Cumberland Ln
- 676 Cumberland Ln
- 673 Cumberland Ln
- 851 Claridge Dr
- 770 Dartmouth Ln
- 777 Dartmouth Ln
- 875 Claridge Dr
- 539 Sudbury Cir
- 711 Blossom Ct Unit 2
- 395 Danforth Dr
- 204 Amherst Cir
- 204 Dorset Ave
- 429 Prairieview Dr
- 2253 Barbera Rd
- 2319 Hirsch Dr
- 6115 Rt 34
- 94 Templeton Dr
- 442 Windsor Dr
- 440 Windsor Dr
- 244 Isleview Dr
- 242 Isleview Dr
- 325 White Pines Ln
- 445 Windsor Dr
- 447 Windsor Dr
- 443 Windsor Dr
- 240 Isleview Dr
- 246 Isleview Dr
- 438 Windsor Dr Unit 1
- 329 White Pines Ln
- 437 Windsor Dr
- 238 Isleview Dr
- 323 White Pines Ln
- 248 Isleview Dr
- 436 Windsor Dr Unit 1
- 331 White Pines Ct
- 107 Bradford Ct
- 245 Isleview Dr
Your Personal Tour Guide
Ask me questions while you tour the home.