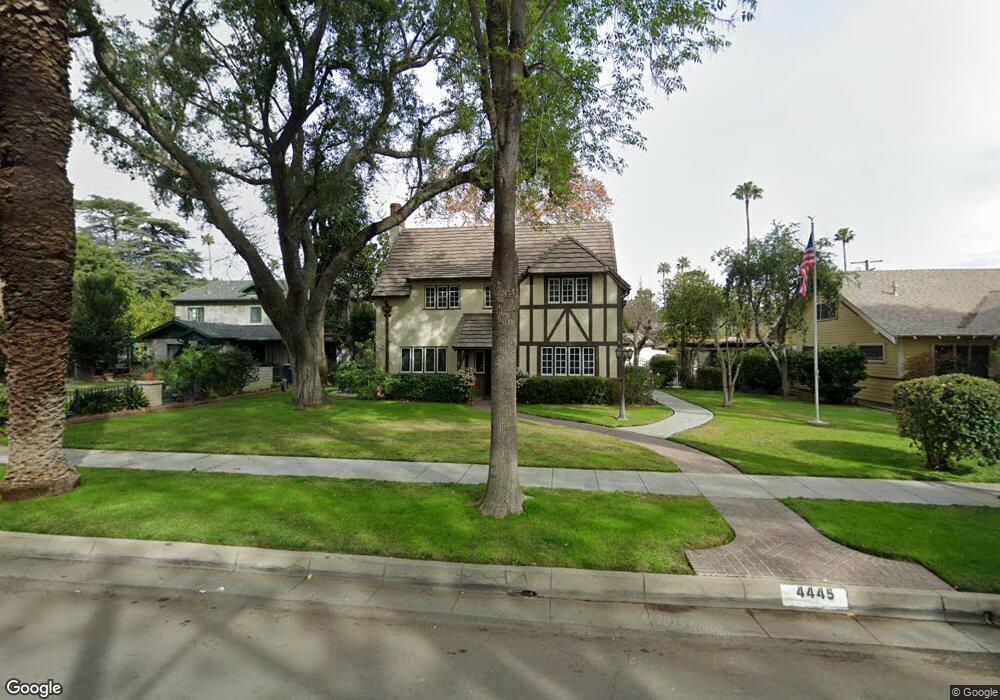
4445 6th St Riverside, CA 92501
Downtown Riverside NeighborhoodEstimated Value: $616,000 - $754,000
3
Beds
3
Baths
1,292
Sq Ft
$532/Sq Ft
Est. Value
About This Home
This home is located at 4445 6th St, Riverside, CA 92501 and is currently estimated at $687,891, approximately $532 per square foot. 4445 6th St is a home located in Riverside County with nearby schools including Bryant Elementary, Central Middle School, and Polytechnic High School.
Ownership History
Date
Name
Owned For
Owner Type
Purchase Details
Closed on
Jul 25, 2003
Sold by
Ontiveros Richard
Bought by
Ontiveros Richard
Current Estimated Value
Home Financials for this Owner
Home Financials are based on the most recent Mortgage that was taken out on this home.
Original Mortgage
$78,000
Interest Rate
5.13%
Mortgage Type
Purchase Money Mortgage
Purchase Details
Closed on
Jun 13, 2002
Sold by
Ontiveros Richard
Bought by
Ontiveros Richard and Family Trust Of Richard Ontiveros
Create a Home Valuation Report for This Property
The Home Valuation Report is an in-depth analysis detailing your home's value as well as a comparison with similar homes in the area
Home Values in the Area
Average Home Value in this Area
Purchase History
| Date | Buyer | Sale Price | Title Company |
|---|---|---|---|
| Ontiveros Richard | -- | Lawyers Title Company | |
| Ontiveros Richard | -- | -- |
Source: Public Records
Mortgage History
| Date | Status | Borrower | Loan Amount |
|---|---|---|---|
| Closed | Ontiveros Richard | $78,000 |
Source: Public Records
Tax History
| Year | Tax Paid | Tax Assessment Tax Assessment Total Assessment is a certain percentage of the fair market value that is determined by local assessors to be the total taxable value of land and additions on the property. | Land | Improvement |
|---|---|---|---|---|
| 2025 | $2,848 | $266,420 | $37,716 | $228,704 |
| 2023 | $2,848 | $256,076 | $36,252 | $219,824 |
| 2022 | $2,781 | $251,056 | $35,542 | $215,514 |
| 2021 | $2,752 | $246,135 | $34,846 | $211,289 |
| 2020 | $2,730 | $243,612 | $34,489 | $209,123 |
| 2019 | $2,678 | $238,836 | $33,813 | $205,023 |
| 2018 | $2,625 | $234,153 | $33,151 | $201,002 |
| 2017 | $2,578 | $229,562 | $32,501 | $197,061 |
| 2016 | $2,413 | $225,062 | $31,864 | $193,198 |
| 2015 | $2,377 | $221,684 | $31,387 | $190,297 |
| 2014 | $2,353 | $217,343 | $30,773 | $186,570 |
Source: Public Records
Map
Nearby Homes
- 3770 Locust St
- 4202 University Ave
- 4631 Ladera Ln
- 4161 University Ave
- 0 Beacon Way
- 4280 9th St
- 0 Indian Hill Rd Unit IG24181665
- 4600 9th St
- 4347 2nd St
- 4073 Cedar St
- 4096 Pine St
- 3142 Cedar St
- 4415 12th St
- 3024 Pine St
- 4481 13th St
- 4227 Miramonte Place
- 4160 Chestnut St
- 0 371 0 Hwy
- 2715 Brockton Ave
- 4121 Park View Terrace
Your Personal Tour Guide
Ask me questions while you tour the home.