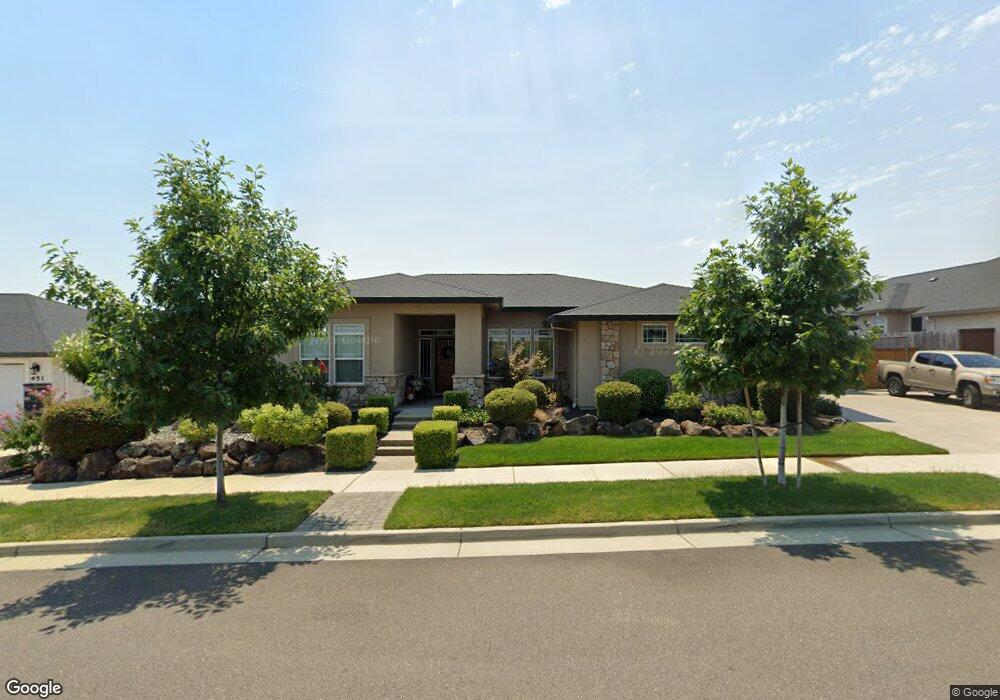
445 Belvedere Dr Redding, CA 96003
Tanglewood NeighborhoodEstimated Value: $641,944 - $806,000
4
Beds
3
Baths
2,788
Sq Ft
$265/Sq Ft
Est. Value
About This Home
This home is located at 445 Belvedere Dr, Redding, CA 96003 and is currently estimated at $737,986, approximately $264 per square foot. 445 Belvedere Dr is a home located in Shasta County with nearby schools including Boulder Creek Elementary School, Enterprise High School, and Bethel Christian School.
Ownership History
Date
Name
Owned For
Owner Type
Purchase Details
Closed on
May 1, 2017
Sold by
Limas John A and Limas Heidi A
Bought by
Limas John A and Limas Heidi A
Current Estimated Value
Home Financials for this Owner
Home Financials are based on the most recent Mortgage that was taken out on this home.
Original Mortgage
$138,888
Outstanding Balance
$115,859
Interest Rate
4.3%
Mortgage Type
New Conventional
Estimated Equity
$622,127
Purchase Details
Closed on
Apr 4, 2017
Sold by
S&J Development Inc
Bought by
Limas John A and Limas Heidi A
Home Financials for this Owner
Home Financials are based on the most recent Mortgage that was taken out on this home.
Original Mortgage
$138,888
Outstanding Balance
$115,859
Interest Rate
4.3%
Mortgage Type
New Conventional
Estimated Equity
$622,127
Purchase Details
Closed on
Mar 17, 2015
Sold by
J&S Highland Park Llc
Bought by
S&J Development Inc
Create a Home Valuation Report for This Property
The Home Valuation Report is an in-depth analysis detailing your home's value as well as a comparison with similar homes in the area
Home Values in the Area
Average Home Value in this Area
Purchase History
| Date | Buyer | Sale Price | Title Company |
|---|---|---|---|
| Limas John A | -- | None Available | |
| Limas John A | $589,000 | Placer Title Company | |
| S&J Development Inc | $585,000 | Placer Title Company |
Source: Public Records
Mortgage History
| Date | Status | Borrower | Loan Amount |
|---|---|---|---|
| Open | Limas John A | $138,888 |
Source: Public Records
Tax History
| Year | Tax Paid | Tax Assessment Tax Assessment Total Assessment is a certain percentage of the fair market value that is determined by local assessors to be the total taxable value of land and additions on the property. | Land | Improvement |
|---|---|---|---|---|
| 2025 | $7,619 | $683,448 | $133,464 | $549,984 |
| 2024 | $7,542 | $670,048 | $130,848 | $539,200 |
| 2023 | $7,542 | $656,911 | $128,283 | $528,628 |
| 2022 | $7,329 | $644,031 | $125,768 | $518,263 |
| 2021 | $7,064 | $631,403 | $123,302 | $508,101 |
| 2020 | $6,987 | $624,930 | $122,038 | $502,892 |
| 2019 | $6,876 | $612,678 | $119,646 | $493,032 |
| 2018 | $6,774 | $600,665 | $117,300 | $483,365 |
| 2017 | $6,233 | $524,488 | $72,488 | $452,000 |
| 2016 | $1,140 | $95,567 | $71,067 | $24,500 |
| 2015 | $660 | $59,709 | $59,709 | $0 |
Source: Public Records
Map
Nearby Homes
- 592 Mill Valley Pkwy
- 531 Fair Hill Dr
- 651 Mission de Oro Dr
- 672 Reddington Dr
- 667 Reddington Dr
- 771 Flower Ash Ln
- 639 Alamine Dr
- 856 Mission de Oro Dr
- 825 Mission Sierra Ct
- 454 Alamine Dr
- 647 Olympic St
- 775 Stonebriar Trail
- 244 Woodhill Dr
- 724 Oakhurst Trail
- 1026 Palisades Ave
- 11037 Erickson Way
- 1088 Burton Dr
- 5663 Terra Linda Way
- 225 Ridgetop Dr Unit 214
- 332 Franciscan Trail
- 445 Belvedere Dr Unit LOT 8-8
- 342 Reddington Dr
- 342 Reddington Dr Unit Lot 21Unit 8
- 439 Belvedere Dr
- 451 Belvedere Dr
- 451 Belvedere Dr Unit 8 lot 9
- 334 Reddington Dr
- 350 Reddington Dr
- 433 Belvedere Dr
- 457 Belvedere Dr
- 358 Reddington Dr
- 358 Reddington Dr
- 358 Reddington Dr Unit 8 Lot 19
- 326 Reddington Dr
- 376 Stinson Loop
- 434 Belvedere Dr
- 427 Belvedere Dr
- 460 Belvedere Dr Unit 5-8
- 460 Belvedere Dr
- 366 Reddington Dr Unit 8 Lot 18
Your Personal Tour Guide
Ask me questions while you tour the home.