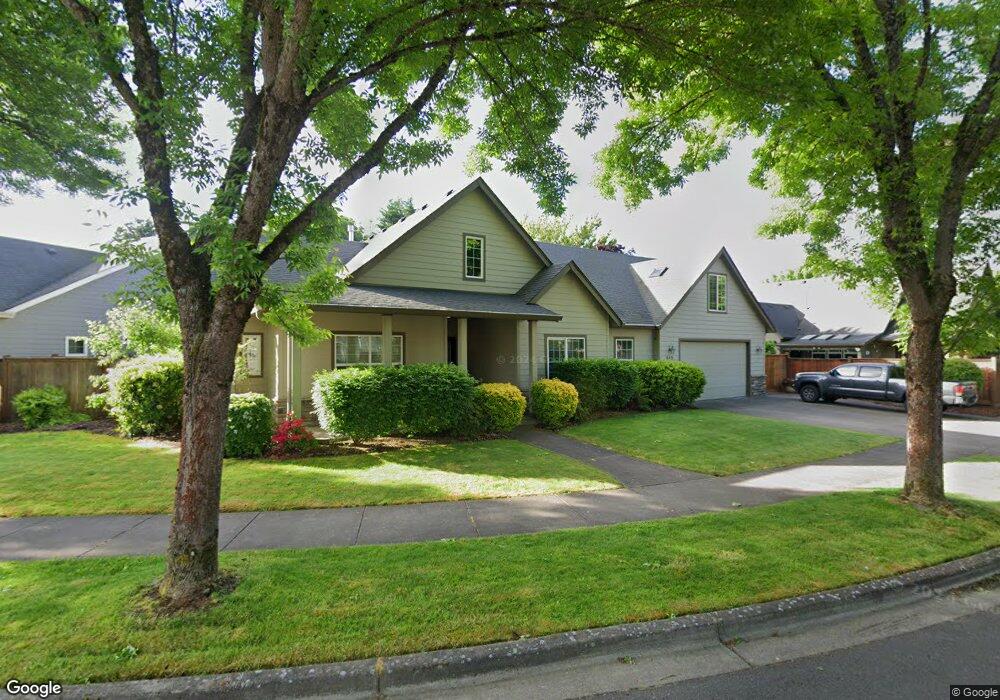
445 Salty Way Eugene, OR 97404
Santa Clara NeighborhoodEstimated Value: $672,284 - $765,000
4
Beds
3
Baths
2,261
Sq Ft
$316/Sq Ft
Est. Value
About This Home
This home is located at 445 Salty Way, Eugene, OR 97404 and is currently estimated at $715,571, approximately $316 per square foot. 445 Salty Way is a home located in Lane County with nearby schools including Awbrey Park Elementary School, Madison Middle School, and North Eugene High School.
Ownership History
Date
Name
Owned For
Owner Type
Purchase Details
Closed on
Jun 29, 2004
Sold by
Crescent Homes Inc
Bought by
Trumbull Tyler E and Trumbull Lisa R
Current Estimated Value
Home Financials for this Owner
Home Financials are based on the most recent Mortgage that was taken out on this home.
Original Mortgage
$240,150
Outstanding Balance
$118,657
Interest Rate
6.27%
Mortgage Type
Purchase Money Mortgage
Estimated Equity
$596,914
Purchase Details
Closed on
Feb 17, 2004
Sold by
Kids Enterprises Llc
Bought by
Crescent Homes Inc
Create a Home Valuation Report for This Property
The Home Valuation Report is an in-depth analysis detailing your home's value as well as a comparison with similar homes in the area
Home Values in the Area
Average Home Value in this Area
Purchase History
| Date | Buyer | Sale Price | Title Company |
|---|---|---|---|
| Trumbull Tyler E | $300,208 | Western Title & Escrow Co | |
| Crescent Homes Inc | $81,900 | American Title Group |
Source: Public Records
Mortgage History
| Date | Status | Borrower | Loan Amount |
|---|---|---|---|
| Open | Trumbull Tyler E | $240,150 |
Source: Public Records
Tax History Compared to Growth
Tax History
| Year | Tax Paid | Tax Assessment Tax Assessment Total Assessment is a certain percentage of the fair market value that is determined by local assessors to be the total taxable value of land and additions on the property. | Land | Improvement |
|---|---|---|---|---|
| 2025 | $7,738 | $397,171 | -- | -- |
| 2024 | $7,642 | $385,603 | -- | -- |
| 2023 | $7,642 | $374,372 | $0 | $0 |
| 2022 | $7,159 | $363,468 | $0 | $0 |
| 2021 | $6,724 | $352,882 | $0 | $0 |
| 2020 | $6,748 | $342,604 | $0 | $0 |
| 2019 | $6,492 | $332,626 | $0 | $0 |
| 2018 | $5,982 | $313,532 | $0 | $0 |
| 2017 | $5,658 | $313,532 | $0 | $0 |
| 2016 | $5,550 | $304,400 | $0 | $0 |
| 2015 | $5,327 | $295,534 | $0 | $0 |
| 2014 | $5,109 | $286,926 | $0 | $0 |
Source: Public Records
Map
Nearby Homes
- 454 Salty Way
- 460 Salty Way
- 240 Dibblee Ln
- 190 Hunsaker Ln
- 190 River Loop 1
- 495 Autumn Ave
- 2566 Janelle Way
- 2655 Atticus Way
- 3346 Zane Ln
- 3322 Gardenia Way
- 3352 Zane Ln
- 193 Santa Clara Ave
- 185 Ferndale Dr
- 305 Irving Rd
- 3241 Cindy St
- 825 River Ave
- 303 Lenore Loop
- 3565 Castrey St
- 3724 Alladin Way
- 3755 Julia Loop