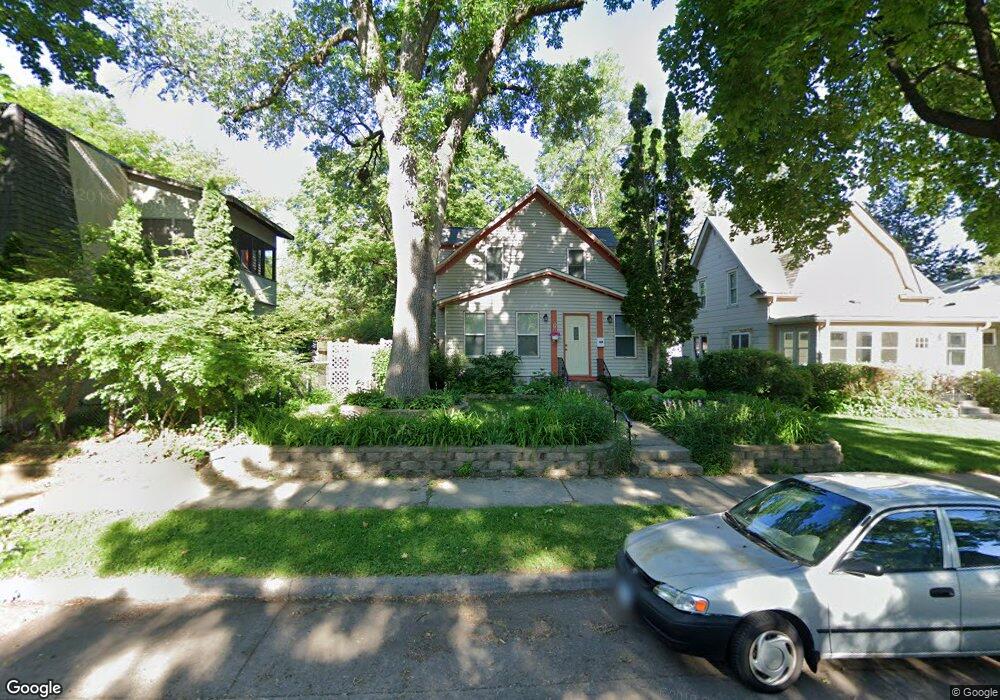
4452 4452 33rd-Avenue-s Minneapolis, MN 55406
Ericsson NeighborhoodEstimated Value: $379,000 - $414,590
3
Beds
1
Bath
1,510
Sq Ft
$262/Sq Ft
Est. Value
About This Home
This home is located at 4452 4452 33rd-Avenue-s, Minneapolis, MN 55406 and is currently estimated at $395,398, approximately $261 per square foot. 4452 4452 33rd-Avenue-s is a home located in Hennepin County with nearby schools including Northrop Elementary School, Sanford Middle School, and Roosevelt Senior High School.
Ownership History
Date
Name
Owned For
Owner Type
Purchase Details
Closed on
Jul 23, 2021
Sold by
Johnson Joel and Johnson Ingrid Schubert
Bought by
Johnson Christopher E and Johnson Kathleen M
Current Estimated Value
Home Financials for this Owner
Home Financials are based on the most recent Mortgage that was taken out on this home.
Original Mortgage
$272,000
Outstanding Balance
$247,173
Interest Rate
3%
Mortgage Type
New Conventional
Estimated Equity
$148,225
Purchase Details
Closed on
Aug 18, 2008
Sold by
Mers Inc
Bought by
Johnson Joel G and Johnson Ingrid S
Purchase Details
Closed on
Mar 30, 2006
Sold by
Baker David M
Bought by
Zizi Audrey Y
Purchase Details
Closed on
Jun 30, 2004
Sold by
Grosan Sherry
Bought by
Baker David M
Purchase Details
Closed on
May 30, 2000
Sold by
Twin Cities Habitat For Humanity Inc
Bought by
Grosch Sherry
Create a Home Valuation Report for This Property
The Home Valuation Report is an in-depth analysis detailing your home's value as well as a comparison with similar homes in the area
Home Values in the Area
Average Home Value in this Area
Purchase History
| Date | Buyer | Sale Price | Title Company |
|---|---|---|---|
| Johnson Christopher E | $340,000 | Executive Title Services | |
| Johnson Joel G | $130,000 | -- | |
| Zizi Audrey Y | $280,000 | -- | |
| Baker David M | $193,000 | -- | |
| Grosch Sherry | $121,500 | -- | |
| Johnson Christopher Christopher | $340,000 | -- |
Source: Public Records
Mortgage History
| Date | Status | Borrower | Loan Amount |
|---|---|---|---|
| Open | Johnson Christopher E | $272,000 | |
| Closed | Johnson Christopher Christopher | $272,000 |
Source: Public Records
Tax History Compared to Growth
Tax History
| Year | Tax Paid | Tax Assessment Tax Assessment Total Assessment is a certain percentage of the fair market value that is determined by local assessors to be the total taxable value of land and additions on the property. | Land | Improvement |
|---|---|---|---|---|
| 2024 | $5,436 | $378,000 | $148,000 | $230,000 |
| 2023 | $5,094 | $391,000 | $143,000 | $248,000 |
| 2022 | $4,479 | $356,000 | $118,000 | $238,000 |
| 2021 | $4,330 | $330,000 | $82,000 | $248,000 |
| 2020 | $4,448 | $330,000 | $80,200 | $249,800 |
| 2019 | $4,341 | $314,500 | $54,700 | $259,800 |
| 2018 | $3,731 | $299,500 | $54,700 | $244,800 |
| 2017 | $3,544 | $243,500 | $49,700 | $193,800 |
| 2016 | $3,452 | $231,500 | $49,700 | $181,800 |
| 2015 | $3,379 | $218,000 | $49,700 | $168,300 |
| 2014 | -- | $201,000 | $49,700 | $151,300 |
Source: Public Records
Map
Nearby Homes
- 4332 34th Ave S
- 4356 Nokomis Ave
- 4552 Nokomis Ave
- 4201 33rd Ave S
- 4452 29th Ave S
- 4524 29th Ave S
- 4400 29th Ave S
- 4224 30th Ave S
- 3605 E 47th St
- 4126 31st Ave S
- 4225 28th Ave S
- 4702 38th Ave S
- 4244 28th Ave S
- 4809 31st Ave S
- 4122 Cheatham Ave
- 4816 31st Ave S
- 4243 Minnehaha Ave
- 2810 E Minnehaha Pkwy
- 4217 27th Ave S
- 4520 41st Ave S
- 4452 33rd Ave S
- 4456 33rd Ave S
- 4448 33rd Ave S
- 4448 33rd Ave S
- 4444 33rd Ave S
- 4440 33rd Ave S
- 4500 33rd Ave S
- 4453 32nd Ave S
- 4449 32nd Ave S
- 4457 32nd Ave S
- 4436 33rd Ave S
- 4445 32nd Ave S
- 4504 33rd Ave S
- 4441 32nd Ave S
- 3211 E 45th St
- 4432 33rd Ave S
- 4453 33rd Ave S
- 4457 33rd Ave S
- 4449 33rd Ave S
- 4445 33rd Ave S