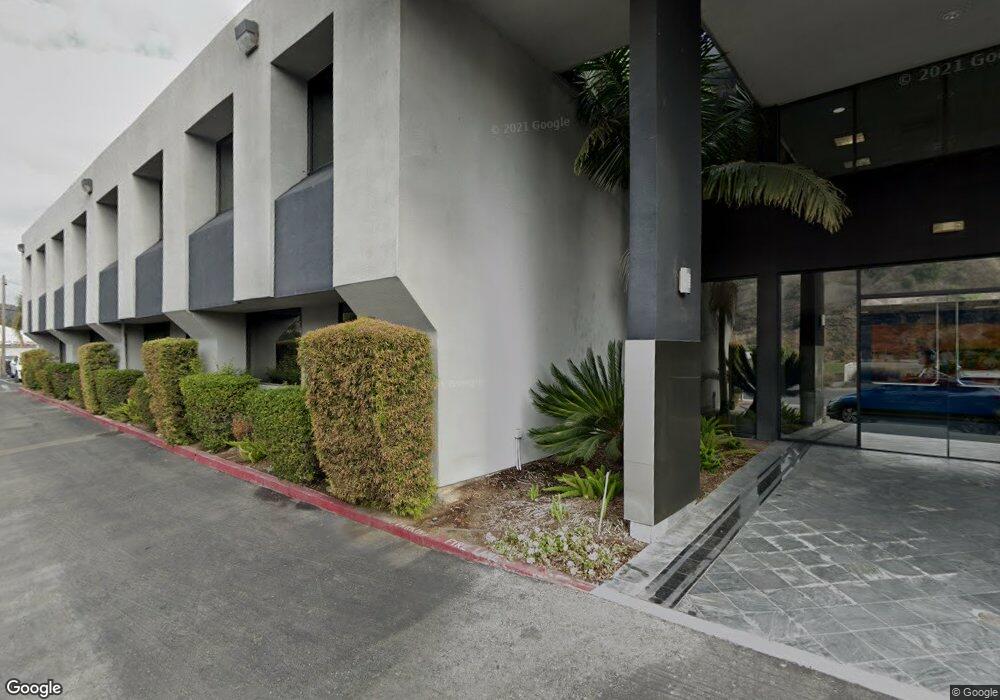
4455 Morena Blvd Unit 109 San Diego, CA 92117
Bay Ho NeighborhoodEstimated Value: $854,613
--
Bed
--
Bath
1,156
Sq Ft
$739/Sq Ft
Est. Value
About This Home
This home is located at 4455 Morena Blvd Unit 109, San Diego, CA 92117 and is currently estimated at $854,613, approximately $739 per square foot. 4455 Morena Blvd Unit 109 is a home located in San Diego County with nearby schools including Cadman Elementary School, Marston Middle School, and Clairemont High School.
Ownership History
Date
Name
Owned For
Owner Type
Purchase Details
Closed on
Sep 7, 2017
Sold by
Montal Steven S
Bought by
Desmos Llc
Current Estimated Value
Purchase Details
Closed on
Aug 9, 2017
Sold by
Montal Mauricio and Montal Myrta
Bought by
Montal Steven S
Purchase Details
Closed on
Sep 26, 2011
Sold by
Joyner Marisa
Bought by
Montal Mauricio and Montal Myrta
Purchase Details
Closed on
May 16, 2011
Sold by
Joyner Gregory T and Joyner Marisa A
Bought by
Joyner Marisa
Purchase Details
Closed on
Jan 6, 2006
Sold by
Morena Executive Plaza Llc
Bought by
Joyner Gregory T and Joyner Marisa A
Home Financials for this Owner
Home Financials are based on the most recent Mortgage that was taken out on this home.
Original Mortgage
$266,400
Interest Rate
6.25%
Mortgage Type
Commercial
Create a Home Valuation Report for This Property
The Home Valuation Report is an in-depth analysis detailing your home's value as well as a comparison with similar homes in the area
Home Values in the Area
Average Home Value in this Area
Purchase History
| Date | Buyer | Sale Price | Title Company |
|---|---|---|---|
| Desmos Llc | -- | None Available | |
| Montal Steven S | -- | None Available | |
| Montal Mauricio | $300,000 | California Title Company | |
| Joyner Marisa | -- | None Available | |
| Joyner Gregory T | $422,500 | Chicago Title Co |
Source: Public Records
Mortgage History
| Date | Status | Borrower | Loan Amount |
|---|---|---|---|
| Previous Owner | Joyner Gregory T | $266,400 |
Source: Public Records
Tax History Compared to Growth
Tax History
| Year | Tax Paid | Tax Assessment Tax Assessment Total Assessment is a certain percentage of the fair market value that is determined by local assessors to be the total taxable value of land and additions on the property. | Land | Improvement |
|---|---|---|---|---|
| 2025 | $4,576 | $376,804 | $226,084 | $150,720 |
| 2024 | $4,576 | $369,416 | $221,651 | $147,765 |
| 2023 | $4,474 | $362,173 | $217,305 | $144,868 |
| 2022 | $4,355 | $355,073 | $213,045 | $142,028 |
| 2021 | $4,326 | $348,112 | $208,868 | $139,244 |
| 2020 | $4,274 | $344,544 | $206,727 | $137,817 |
| 2019 | $4,198 | $337,789 | $202,674 | $135,115 |
| 2018 | $3,926 | $331,166 | $198,700 | $132,466 |
| 2017 | $3,832 | $324,673 | $194,804 | $129,869 |
| 2016 | $3,770 | $318,308 | $190,985 | $127,323 |
| 2015 | $3,714 | $313,528 | $188,117 | $125,411 |
| 2014 | $3,657 | $307,388 | $184,433 | $122,955 |
Source: Public Records
Map
Nearby Homes
- 4425 Caminito Pedernal
- 5259 Pacifica Dr
- 3129 Driscoll Dr
- 4135 Huerfano Ave
- 4060 Huerfano Ave Unit 146
- 4060 Huerfano Ave Unit 130
- 4060 Huerfano Ave Unit 125
- 4060 Huerfano Ave Unit 240
- 4060 Huerfano Ave Unit 109
- 4060 Huerfano Ave Unit 126
- 2294 Caminito Preciosa Norte
- 3212 Cadden Ct
- 2481 La Marque St
- 5227 Middleton Rd
- 4048 Raffee Dr
- 2252 Soledad Rancho Rd
- 2515 Geranium St
- 4010 Paducah Dr
- 4543 Moraga Ave
- 3903 Cadden Way
- 4455 Morena Blvd
- 4455 Morena Blvd
- 4455 Morena Blvd # 109
- 4455 4455 Morena Blvd # 109
- 4455 SUITE 4455 Suite 210 Morena Blvd
- 4455 4455 Morena Blvd
- 4390 Conner Ct
- 4391 Conner Ct
- 4378 Conner Ct
- 4379 Conner Ct
- 4366 Conner Ct
- 4367 Conner Ct
- 4288 Conner Ct
- 4278 Conner Ct
- 4326 Conner Ct
- 4268 Conner Ct
- 4343 Morena Blvd
- 4258 Conner Ct
- 4355 Conner Ct
- 4248 Conner Ct