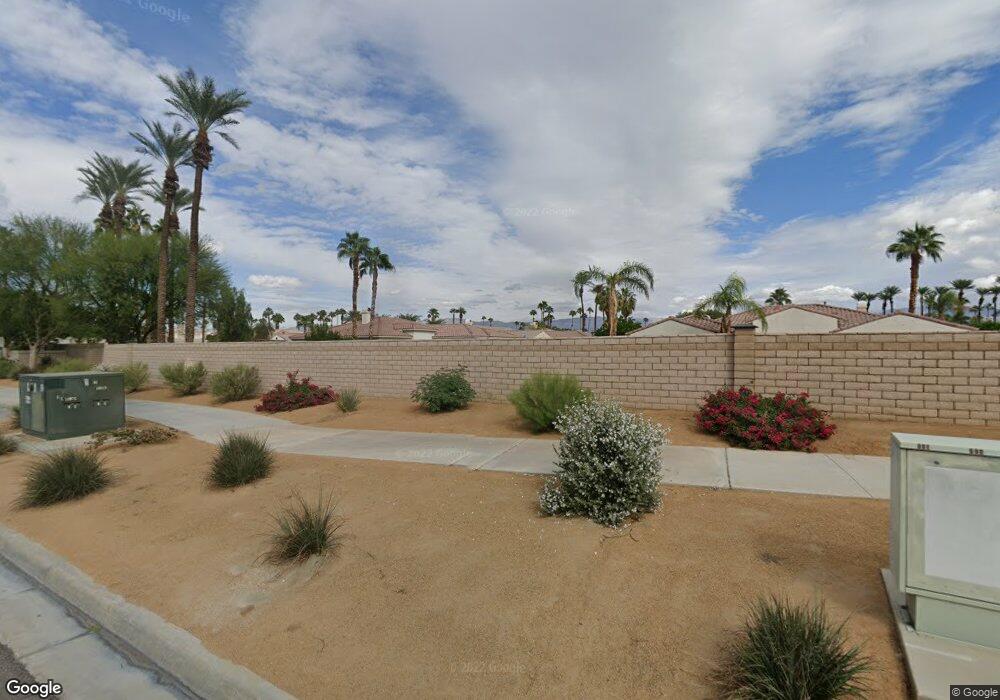
44575 Via Terra Nova La Quinta, CA 92253
Estimated Value: $714,969 - $882,000
4
Beds
3
Baths
2,725
Sq Ft
$288/Sq Ft
Est. Value
About This Home
This home is located at 44575 Via Terra Nova, La Quinta, CA 92253 and is currently estimated at $784,492, approximately $287 per square foot. 44575 Via Terra Nova is a home located in Riverside County with nearby schools including Gerald R. Ford Elementary School, John Glenn Middle School Of International Studies, and La Quinta High School.
Ownership History
Date
Name
Owned For
Owner Type
Purchase Details
Closed on
Jun 19, 2021
Sold by
Pelayo Johnson
Bought by
Pelayo Johnson A and Pelayo Maria Elizabeth
Current Estimated Value
Purchase Details
Closed on
Jun 19, 2018
Sold by
Pelayo Johnson
Bought by
Pelayo Johnson
Home Financials for this Owner
Home Financials are based on the most recent Mortgage that was taken out on this home.
Original Mortgage
$380,000
Outstanding Balance
$328,636
Interest Rate
4.5%
Mortgage Type
New Conventional
Estimated Equity
$455,856
Purchase Details
Closed on
Aug 24, 2016
Sold by
Pelayo Maria Elizabeth D
Bought by
Pelayo Johson
Purchase Details
Closed on
Oct 26, 2011
Sold by
Rehak Joseph
Bought by
Pelayo Johnson and Pelayo Maria Elizabeth D
Home Financials for this Owner
Home Financials are based on the most recent Mortgage that was taken out on this home.
Original Mortgage
$263,155
Interest Rate
4.5%
Mortgage Type
FHA
Purchase Details
Closed on
Apr 12, 2005
Sold by
Lennar Homes Of California Inc
Bought by
Rehak Joseph
Home Financials for this Owner
Home Financials are based on the most recent Mortgage that was taken out on this home.
Original Mortgage
$461,650
Interest Rate
6%
Mortgage Type
Fannie Mae Freddie Mac
Create a Home Valuation Report for This Property
The Home Valuation Report is an in-depth analysis detailing your home's value as well as a comparison with similar homes in the area
Home Values in the Area
Average Home Value in this Area
Purchase History
| Date | Buyer | Sale Price | Title Company |
|---|---|---|---|
| Pelayo Johnson A | -- | None Available | |
| Pelayo Johnson | -- | None Available | |
| Pelayo Johson | -- | None Available | |
| Pelayo Johnson | $270,000 | Nations Title Company | |
| Rehak Joseph | $577,500 | North American Title Company |
Source: Public Records
Mortgage History
| Date | Status | Borrower | Loan Amount |
|---|---|---|---|
| Open | Pelayo Johnson | $380,000 | |
| Closed | Pelayo Johnson | $263,155 | |
| Previous Owner | Rehak Joseph | $461,650 |
Source: Public Records
Tax History Compared to Growth
Tax History
| Year | Tax Paid | Tax Assessment Tax Assessment Total Assessment is a certain percentage of the fair market value that is determined by local assessors to be the total taxable value of land and additions on the property. | Land | Improvement |
|---|---|---|---|---|
| 2025 | $4,792 | $343,432 | $94,951 | $248,481 |
| 2023 | $4,792 | $330,098 | $91,265 | $238,833 |
| 2022 | $4,492 | $323,626 | $89,476 | $234,150 |
| 2021 | $4,378 | $317,281 | $87,722 | $229,559 |
| 2020 | $4,299 | $314,029 | $86,823 | $227,206 |
| 2019 | $4,212 | $307,872 | $85,121 | $222,751 |
| 2018 | $4,121 | $301,836 | $83,452 | $218,384 |
| 2017 | $4,050 | $295,918 | $81,816 | $214,102 |
| 2016 | $4,050 | $290,116 | $80,212 | $209,904 |
| 2015 | $4,062 | $285,760 | $79,008 | $206,752 |
| 2014 | $3,999 | $280,164 | $77,461 | $202,703 |
Source: Public Records
Map
Nearby Homes
- 44520 Via Terra Nova
- 78179 Crimson Ct Unit 334
- 78171 Crimson Ct
- 78127 Crimson Ct
- 78199 Indigo Dr
- 78197 Indigo Dr
- 78209 Indigo Dr
- 78229 Indigo Dr
- 78143 Indigo Dr
- 78347 Scarlet Ct
- 78077 Cobalt Ct Unit 159
- 78069 Cobalt Ct
- 78440 Via Palomino
- 44830 Via Mirabel
- 78347 Terra Cotta Ct
- 78373 Terra Cotta Ct Unit 106
- 44865 Via Alondra
- 78379 Terra Cotta Ct Unit 109
- 78487 Magenta Dr
- 43875 Milan Ct
- 44555 Via Terra Nova
- 44595 Via Terra Nova
- 44580 Via Terra Nova
- 78230 Via Pavion
- 44560 Via Terra Nova
- 44420 Via Del Sol
- 78240 Via Pavion
- 44540 Via Terra Nova
- 78270 Via Sevilla
- 44435 Via Del Sol
- 78280 Via Sevilla
- 44665 Via Venice
- 44645 Via Venice
- 78290 Via Sevilla
- 78250 Via Pavion
- 44625 Via Venice
- 44425 Via Del Sol
- 44410 Via Del Sol
- 78300 Via Sevilla
- 78300 Via Sevilla