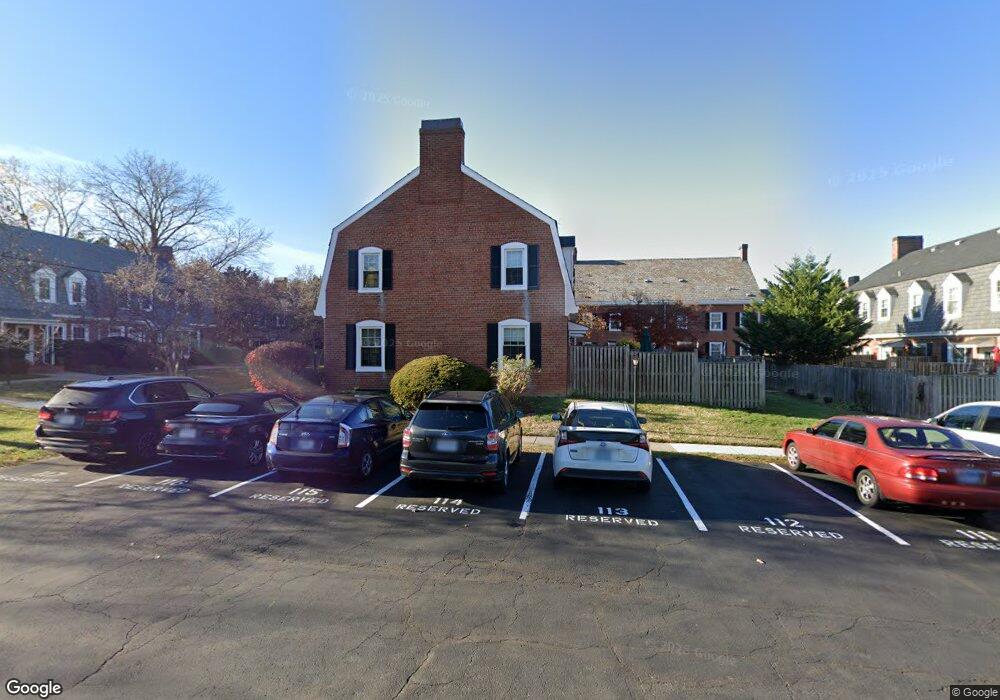
4458 36th St S Arlington, VA 22206
Fairlington NeighborhoodEstimated Value: $579,000 - $603,000
2
Beds
2
Baths
1,500
Sq Ft
$396/Sq Ft
Est. Value
About This Home
This home is located at 4458 36th St S, Arlington, VA 22206 and is currently estimated at $593,508, approximately $395 per square foot. 4458 36th St S is a home located in Arlington County with nearby schools including Abingdon Elementary School, Gunston Middle School, and Wakefield High School.
Ownership History
Date
Name
Owned For
Owner Type
Purchase Details
Closed on
May 19, 2021
Sold by
Stripling Roy M
Bought by
Janssen Miles Erwin and Israel Kendre Elise
Current Estimated Value
Home Financials for this Owner
Home Financials are based on the most recent Mortgage that was taken out on this home.
Original Mortgage
$403,200
Outstanding Balance
$365,400
Interest Rate
3.1%
Mortgage Type
New Conventional
Estimated Equity
$228,108
Purchase Details
Closed on
Jun 9, 2006
Sold by
Black Barbara
Bought by
Stripling Roy
Home Financials for this Owner
Home Financials are based on the most recent Mortgage that was taken out on this home.
Original Mortgage
$300,000
Interest Rate
6.62%
Mortgage Type
New Conventional
Purchase Details
Closed on
Nov 6, 2002
Sold by
Guthrie Donald
Bought by
Black Barbara
Home Financials for this Owner
Home Financials are based on the most recent Mortgage that was taken out on this home.
Original Mortgage
$230,000
Interest Rate
6.04%
Create a Home Valuation Report for This Property
The Home Valuation Report is an in-depth analysis detailing your home's value as well as a comparison with similar homes in the area
Home Values in the Area
Average Home Value in this Area
Purchase History
| Date | Buyer | Sale Price | Title Company |
|---|---|---|---|
| Janssen Miles Erwin | $504,000 | Federal Title & Escrow | |
| Stripling Roy | $455,000 | -- | |
| Black Barbara | $295,000 | -- |
Source: Public Records
Mortgage History
| Date | Status | Borrower | Loan Amount |
|---|---|---|---|
| Open | Janssen Miles Erwin | $403,200 | |
| Previous Owner | Stripling Roy | $300,000 | |
| Previous Owner | Black Barbara | $230,000 |
Source: Public Records
Tax History
| Year | Tax Paid | Tax Assessment Tax Assessment Total Assessment is a certain percentage of the fair market value that is determined by local assessors to be the total taxable value of land and additions on the property. | Land | Improvement |
|---|---|---|---|---|
| 2025 | $6,460 | $625,400 | $58,000 | $567,400 |
| 2024 | $6,087 | $589,300 | $58,000 | $531,300 |
| 2023 | $5,817 | $564,800 | $58,000 | $506,800 |
| 2022 | $5,719 | $555,200 | $58,000 | $497,200 |
| 2021 | $5,574 | $541,200 | $52,600 | $488,600 |
| 2020 | $5,322 | $518,700 | $52,600 | $466,100 |
| 2019 | $4,893 | $476,900 | $48,000 | $428,900 |
| 2018 | $4,455 | $442,800 | $48,000 | $394,800 |
| 2017 | $4,235 | $421,000 | $48,000 | $373,000 |
| 2016 | $4,103 | $414,000 | $48,000 | $366,000 |
| 2015 | $4,123 | $414,000 | $48,000 | $366,000 |
| 2014 | $4,123 | $414,000 | $48,000 | $366,000 |
Source: Public Records
Map
Nearby Homes
- 4426 36th St S Unit B2
- 4400 36th St S
- 3517 S Utah St
- 2515 N Dearing St
- 3617 S Taylor St
- 2406 N Dearing St Unit 253
- 3757 Keller Ave
- 3588 S Stafford St Unit 1071
- 4241 35th St S Unit B1
- 4647 36th St S Unit A
- 3468 S Stafford St Unit A1
- 3529 S Stafford St Unit B
- 3838 Jay Ave
- 3507 S Stafford St Unit A
- 3523 S Stafford St Unit B
- 3513 S Stafford St Unit A
- 1716 Kingsgate Ct
- 1641 Kenwood Ave
- 1620 Kenwood Ave
- 4628 31st Rd S
- 4460 36th St S Unit 1418
- 4454 36th St S
- 4454 36th St S Unit 1421
- 4456 36th St S
- 4468 36th St S
- 4464 36th St S
- 4506 36th St S Unit B1
- 4506 36th St S Unit A1
- 4506 36th St S Unit B2
- 4506 36th St S Unit A2
- 4448 36th St S
- 4448 36th St S Unit 1423
- 4470 36th St S
- 4450 36th St S
- 4446 36th St S
- 4504 36th St S Unit B2
- 4504 36th St S Unit A2
- 4504 36th St S Unit B1
- 4504 36th St S Unit A1
- 4504 36th St S Unit 1A
Your Personal Tour Guide
Ask me questions while you tour the home.