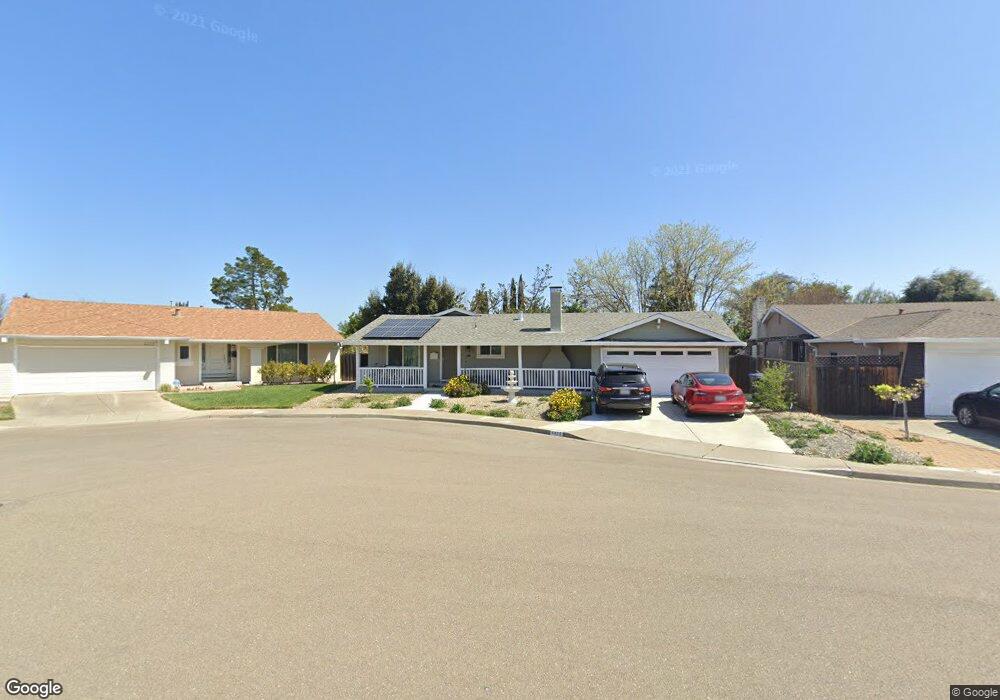
4459 Downing Ct Pleasanton, CA 94588
Stoneridge NeighborhoodEstimated Value: $1,188,000 - $1,305,000
3
Beds
2
Baths
1,378
Sq Ft
$918/Sq Ft
Est. Value
About This Home
This home is located at 4459 Downing Ct, Pleasanton, CA 94588 and is currently estimated at $1,265,680, approximately $918 per square foot. 4459 Downing Ct is a home located in Alameda County with nearby schools including Donlon Elementary School, Thomas S. Hart Middle School, and Foothill High School.
Ownership History
Date
Name
Owned For
Owner Type
Purchase Details
Closed on
Feb 15, 2019
Sold by
Martin Fred R and Martin Family 2005 Trust
Bought by
Jagarlamudi Midhun and Narra Yamini
Current Estimated Value
Home Financials for this Owner
Home Financials are based on the most recent Mortgage that was taken out on this home.
Original Mortgage
$695,200
Outstanding Balance
$603,136
Interest Rate
3.87%
Mortgage Type
Adjustable Rate Mortgage/ARM
Estimated Equity
$662,544
Purchase Details
Closed on
Dec 18, 2015
Sold by
Martin Family Llc
Bought by
Martin Fred R and Martin Family 2005 Trust
Purchase Details
Closed on
Apr 30, 2014
Sold by
Martin Fred R and Martin Family 2005 Trust
Bought by
Martin Family Llc
Purchase Details
Closed on
Apr 7, 2012
Sold by
Nygard Eric W
Bought by
Martin Fred R and The Martin Family 2005 Trust
Purchase Details
Closed on
Dec 20, 2006
Sold by
Martin Fred R and Martin Family 2005 Trust
Bought by
Nygard Eric W
Purchase Details
Closed on
Aug 24, 2005
Sold by
Martin Fred R
Bought by
Martin Fred R and Martin Family 2005 Trust
Create a Home Valuation Report for This Property
The Home Valuation Report is an in-depth analysis detailing your home's value as well as a comparison with similar homes in the area
Home Values in the Area
Average Home Value in this Area
Purchase History
| Date | Buyer | Sale Price | Title Company |
|---|---|---|---|
| Jagarlamudi Midhun | $869,000 | First American Title Company | |
| Martin Fred R | -- | None Available | |
| Martin Family Llc | -- | None Available | |
| Martin Fred R | -- | None Available | |
| Nygard Eric W | -- | None Available | |
| Martin Fred R | -- | -- |
Source: Public Records
Mortgage History
| Date | Status | Borrower | Loan Amount |
|---|---|---|---|
| Open | Jagarlamudi Midhun | $695,200 |
Source: Public Records
Tax History
| Year | Tax Paid | Tax Assessment Tax Assessment Total Assessment is a certain percentage of the fair market value that is determined by local assessors to be the total taxable value of land and additions on the property. | Land | Improvement |
|---|---|---|---|---|
| 2025 | $11,125 | $962,368 | $290,810 | $678,558 |
| 2024 | $11,125 | $943,364 | $285,109 | $665,255 |
| 2023 | $10,996 | $931,732 | $279,519 | $652,213 |
| 2022 | $10,416 | $906,466 | $274,040 | $639,426 |
| 2021 | $10,148 | $888,555 | $268,666 | $626,889 |
| 2020 | $10,018 | $886,380 | $265,914 | $620,466 |
| 2019 | $6,781 | $574,021 | $172,206 | $401,815 |
| 2018 | $6,644 | $562,770 | $168,831 | $393,939 |
| 2017 | $6,475 | $551,734 | $165,520 | $386,214 |
| 2016 | $5,977 | $540,918 | $162,275 | $378,643 |
| 2015 | $5,866 | $532,797 | $159,839 | $372,958 |
| 2014 | $5,971 | $522,360 | $156,708 | $365,652 |
Source: Public Records
Map
Nearby Homes
- 4253 Dorman Rd
- 6354 Dana Ct
- 4580 Harper Ct
- 6168 Inglewood Dr
- 0 Highway 128 Hwy Unit 326001688
- 4061 Holland Dr
- 7326 Hillsdale Dr
- 3921 Alma Ct
- 7332 Stonedale Dr
- 7333 Tulipwood Cir
- 7543 Maywood Dr
- 7551 Maywood Dr
- 3671 Platt Ct S
- 5261 Springdale Ave
- 3460 Serra Cir
- 4159 Amberwood Cir
- 7518 Rosedale Ct
- 7819 Highland Oaks Dr
- 7738 Fairoaks Dr
- 3641 Shenandoah Ct
- 4443 Downing Ct
- 4380 Dorman Ct
- 4475 Downing Ct
- 4427 Downing Ct
- 4354 Dorman Ct
- 4379 Dorman Ct
- 4454 Downing Ct
- 4470 Downing Ct
- 6456 Inglewood Dr
- 6468 Inglewood Dr
- 6444 Inglewood Dr
- 4488 Downing Ct
- 4438 Downing Ct
- 6480 Inglewood Dr
- 4314 Denker Dr
- 4302 Denker Dr
- 6432 Inglewood Dr
- 4353 Dorman Ct
- 4326 Denker Dr
- 4422 Downing Ct
Your Personal Tour Guide
Ask me questions while you tour the home.