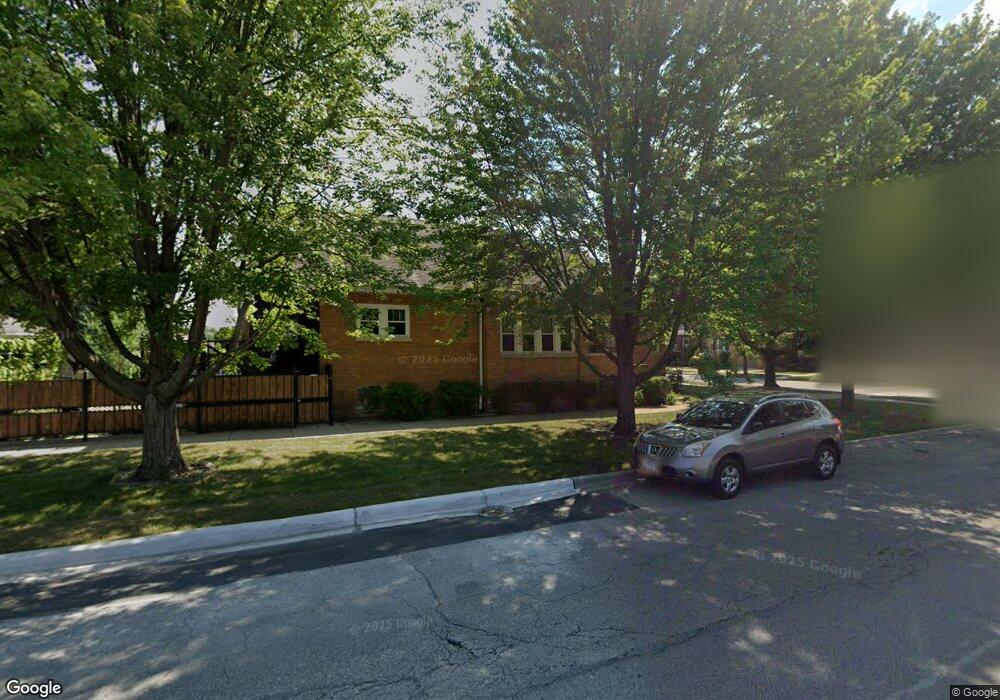
4459 N Major Ave Chicago, IL 60630
Jefferson Park NeighborhoodEstimated Value: $373,000 - $519,000
4
Beds
2
Baths
1,712
Sq Ft
$260/Sq Ft
Est. Value
About This Home
This home is located at 4459 N Major Ave, Chicago, IL 60630 and is currently estimated at $445,565, approximately $260 per square foot. 4459 N Major Ave is a home located in Cook County with nearby schools including Prussing Elementary School, William Howard Taft High School, and St. Robert Bellarmine Catholic School.
Ownership History
Date
Name
Owned For
Owner Type
Purchase Details
Closed on
Sep 5, 2019
Sold by
Birt Thomas and Birt Sarah
Bought by
The Thomas Birt Revocable Trust and The Sarah Birt Revocable Trust
Current Estimated Value
Purchase Details
Closed on
Dec 21, 2000
Sold by
Birt Thomas and Birt Sarah
Bought by
Lasalle National Bank and Trust #1369
Home Financials for this Owner
Home Financials are based on the most recent Mortgage that was taken out on this home.
Original Mortgage
$50,000
Interest Rate
7.1%
Purchase Details
Closed on
Oct 5, 1995
Sold by
Old Kent Bank
Bought by
Associated Bank Gladstone Norwood
Home Financials for this Owner
Home Financials are based on the most recent Mortgage that was taken out on this home.
Original Mortgage
$85,000
Interest Rate
7.91%
Mortgage Type
Seller Take Back
Create a Home Valuation Report for This Property
The Home Valuation Report is an in-depth analysis detailing your home's value as well as a comparison with similar homes in the area
Home Values in the Area
Average Home Value in this Area
Purchase History
| Date | Buyer | Sale Price | Title Company |
|---|---|---|---|
| The Thomas Birt Revocable Trust | -- | None Listed On Document | |
| Lasalle National Bank | -- | -- | |
| Birt Thomas | -- | -- | |
| Associated Bank Gladstone Norwood | $135,000 | -- |
Source: Public Records
Mortgage History
| Date | Status | Borrower | Loan Amount |
|---|---|---|---|
| Previous Owner | Birt Thomas | $50,000 | |
| Previous Owner | Associated Bank Gladstone Norwood | $85,000 |
Source: Public Records
Tax History
| Year | Tax Paid | Tax Assessment Tax Assessment Total Assessment is a certain percentage of the fair market value that is determined by local assessors to be the total taxable value of land and additions on the property. | Land | Improvement |
|---|---|---|---|---|
| 2025 | $5,637 | $38,628 | $15,071 | $23,557 |
| 2024 | $5,637 | $38,628 | $15,071 | $23,557 |
| 2023 | $5,457 | $32,687 | $12,057 | $20,630 |
| 2022 | $5,457 | $32,687 | $12,057 | $20,630 |
| 2021 | $5,367 | $32,686 | $12,056 | $20,630 |
| 2020 | $5,702 | $31,180 | $6,243 | $24,937 |
| 2019 | $6,961 | $34,645 | $6,243 | $28,402 |
| 2018 | $6,844 | $34,645 | $6,243 | $28,402 |
| 2017 | $4,122 | $27,065 | $5,597 | $21,468 |
| 2016 | $5,808 | $28,998 | $5,597 | $23,401 |
| 2015 | $5,314 | $28,998 | $5,597 | $23,401 |
| 2014 | $4,271 | $27,423 | $5,167 | $22,256 |
| 2013 | $4,459 | $29,027 | $5,167 | $23,860 |
Source: Public Records
Map
Nearby Homes
- 4428 N Central Ave Unit 1E
- 5622 W Pensacola Ave
- 5722 W Eastwood Ave
- 5510 W Windsor Ave Unit 1H
- 4314 N Menard Ave
- 5428 W Sunnyside Ave
- 5912 W Wilson Ave
- 5401 W Montrose Ave
- 5709 W Lawrence Ave Unit 3W
- 5354 W Montrose Ave
- 4744 N Lotus Ave
- 4565 N Mcvicker Ave
- 5411 W Lawrence Ave Unit 3C
- 4036 N Parkside Ave
- 4025 N Menard Ave
- 5739 W Grover St
- 4572 N Milwaukee Ave Unit 5H
- 5722 W Grover St
- 4511 N Melvina Ave
- 5706 W Dakin St
- 4455 N Major Ave
- 4451 N Major Ave
- 4449 N Major Ave
- 4445 N Major Ave
- 5639 W Sunnyside Ave
- 4454 N Parkside Ave
- 5652 W Sunnyside Ave
- 4443 N Major Ave
- 4450 N Parkside Ave
- 4446 N Parkside Ave
- 5644 W Sunnyside Ave Unit 2DNFL
- 5644 W Sunnyside Ave
- 4439 N Major Ave
- 5658 W Sunnyside Ave
- 4458 N Major Ave
- 4454 N Major Ave
- 4444 N Parkside Ave
- 5648 W Sunnyside Ave
- 4450 N Major Ave
- 4448 N Major Ave
Your Personal Tour Guide
Ask me questions while you tour the home.