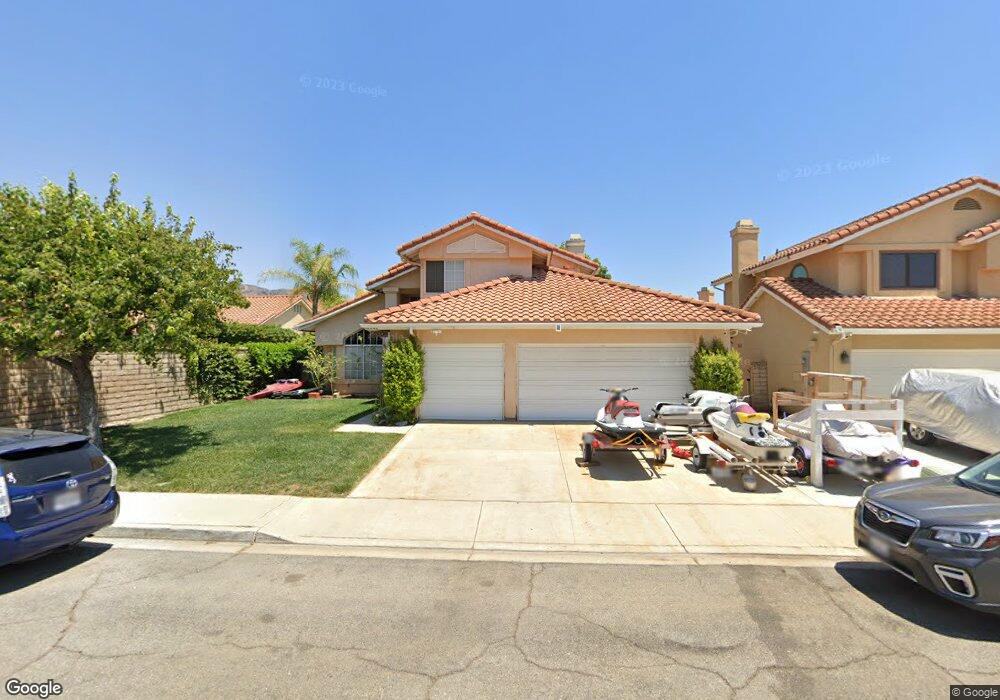
446 Mockingbird Ln Fillmore, CA 93015
Estimated Value: $755,331 - $799,000
4
Beds
3
Baths
2,165
Sq Ft
$361/Sq Ft
Est. Value
About This Home
This home is located at 446 Mockingbird Ln, Fillmore, CA 93015 and is currently estimated at $782,083, approximately $361 per square foot. 446 Mockingbird Ln is a home located in Ventura County with nearby schools including Mountain Vista and Fillmore Senior High.
Ownership History
Date
Name
Owned For
Owner Type
Purchase Details
Closed on
Jan 14, 1998
Sold by
Smithwick Stuart Living Trust
Bought by
Rosten Darren Jon and Rosten Kathleen A
Current Estimated Value
Home Financials for this Owner
Home Financials are based on the most recent Mortgage that was taken out on this home.
Original Mortgage
$185,250
Outstanding Balance
$31,895
Interest Rate
7.05%
Estimated Equity
$750,188
Purchase Details
Closed on
May 15, 1997
Sold by
Stuart Smithwick
Bought by
Smithwick Stuart D
Purchase Details
Closed on
Feb 23, 1994
Sold by
Smithwick Stuart
Bought by
Smithwick Stuart
Home Financials for this Owner
Home Financials are based on the most recent Mortgage that was taken out on this home.
Original Mortgage
$172,500
Interest Rate
4.1%
Create a Home Valuation Report for This Property
The Home Valuation Report is an in-depth analysis detailing your home's value as well as a comparison with similar homes in the area
Home Values in the Area
Average Home Value in this Area
Purchase History
| Date | Buyer | Sale Price | Title Company |
|---|---|---|---|
| Rosten Darren Jon | $195,000 | Old Republic Title Company | |
| Smithwick Stuart D | -- | -- | |
| Smithwick Stuart | -- | Fidelity National Title |
Source: Public Records
Mortgage History
| Date | Status | Borrower | Loan Amount |
|---|---|---|---|
| Open | Rosten Darren Jon | $185,250 | |
| Previous Owner | Smithwick Stuart | $172,500 |
Source: Public Records
Tax History
| Year | Tax Paid | Tax Assessment Tax Assessment Total Assessment is a certain percentage of the fair market value that is determined by local assessors to be the total taxable value of land and additions on the property. | Land | Improvement |
|---|---|---|---|---|
| 2025 | $3,728 | $311,320 | $124,525 | $186,795 |
| 2024 | $3,728 | $305,216 | $122,083 | $183,133 |
| 2023 | $3,701 | $299,232 | $119,689 | $179,543 |
| 2022 | $3,428 | $293,365 | $117,342 | $176,023 |
| 2021 | $3,826 | $287,613 | $115,041 | $172,572 |
| 2020 | $3,562 | $284,665 | $113,862 | $170,803 |
| 2019 | $3,561 | $279,084 | $111,630 | $167,454 |
| 2018 | $3,485 | $273,613 | $109,442 | $164,171 |
| 2017 | $3,493 | $268,249 | $107,297 | $160,952 |
| 2016 | $3,245 | $262,991 | $105,194 | $157,797 |
| 2015 | $3,153 | $259,043 | $103,615 | $155,428 |
| 2014 | $3,221 | $253,972 | $101,587 | $152,385 |
Source: Public Records
Map
Nearby Homes
- 1106 Mockingbird Ln
- 600 C St
- 320 D St
- 1163 W Ventura St
- 202 Avon Ln
- 228 Parkhaven Ct
- 831 Blaine Ave
- 815 Woodgrove Rd
- 809 Woodgrove Rd
- 404 Central Ave
- 340 Central Ave
- 586 Apricot Ln
- 578 Apricot Ln
- 549 Heritage Valley Pkwy
- 513 Heritage Valley Pkwy
- 458 Edgewood Dr
- 871 Oak Ave
- 1172 Oak Ave
- 318 Bard St
- 345 Blaine Ave
- 440 Mockingbird Ln
- 1138 1st St
- 1132 1st St
- 1123 King St
- 434 Mockingbird Ln
- 1126 1st St
- 1121 King St
- 447 Mockingbird Ln
- 441 Mockingbird Ln
- 453 Mockingbird Ln
- 1122 King St
- 1120 1st St
- 428 Mockingbird Ln
- 435 Mockingbird Ln
- 459 Mockingbird Ln
- 1115 King St
- 1114 1st St
- 429 Mockingbird Ln
- 1141 1st St
- 1135 1st St
Your Personal Tour Guide
Ask me questions while you tour the home.