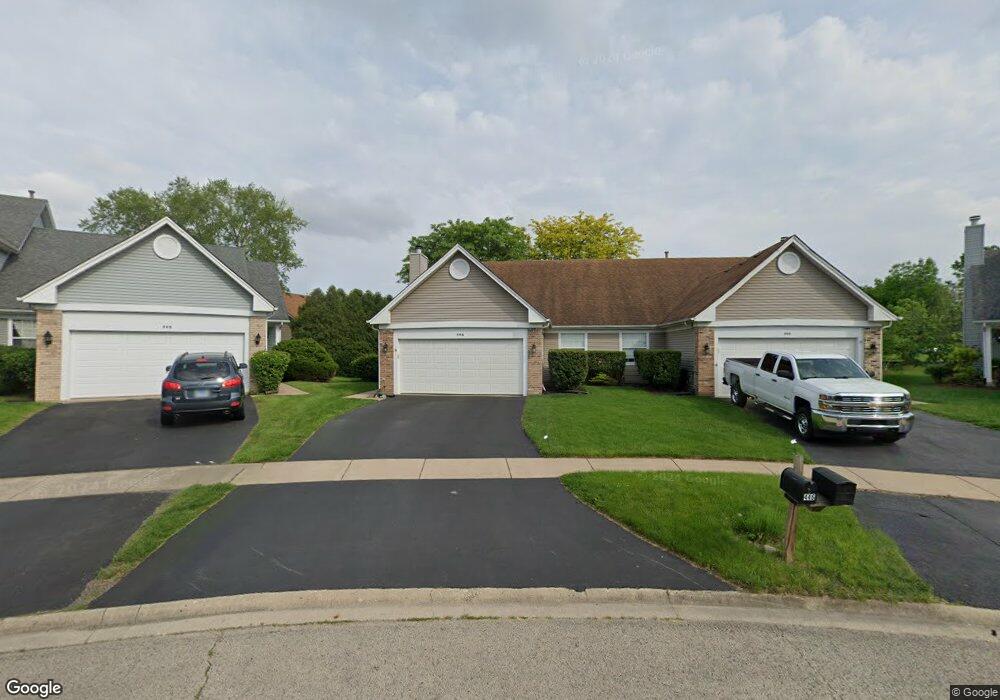
446 Prairieview Dr Oswego, IL 60543
South Oswego NeighborhoodEstimated Value: $279,000 - $313,000
2
Beds
2
Baths
1,346
Sq Ft
$224/Sq Ft
Est. Value
About This Home
This home is located at 446 Prairieview Dr, Oswego, IL 60543 and is currently estimated at $301,607, approximately $224 per square foot. 446 Prairieview Dr is a home located in Kendall County with nearby schools including Prairie Point Elementary School, Traughber Junior High School, and Oswego High School.
Ownership History
Date
Name
Owned For
Owner Type
Purchase Details
Closed on
May 22, 2014
Sold by
Remsen Edward E and Remsen Kathryn B
Bought by
Goodyear Terrance L and Goodyear Shirley A
Current Estimated Value
Home Financials for this Owner
Home Financials are based on the most recent Mortgage that was taken out on this home.
Original Mortgage
$84,900
Outstanding Balance
$25,496
Interest Rate
3.87%
Mortgage Type
New Conventional
Estimated Equity
$276,111
Purchase Details
Closed on
Sep 29, 2003
Sold by
Condon Lowell D and Condon Donna L
Bought by
Remsen Edward E and Remsen Kathryn B
Home Financials for this Owner
Home Financials are based on the most recent Mortgage that was taken out on this home.
Original Mortgage
$81,000
Interest Rate
5.75%
Mortgage Type
Purchase Money Mortgage
Purchase Details
Closed on
Jan 1, 1993
Bought by
Condon Lowell D and Condon Donna L
Create a Home Valuation Report for This Property
The Home Valuation Report is an in-depth analysis detailing your home's value as well as a comparison with similar homes in the area
Home Values in the Area
Average Home Value in this Area
Purchase History
| Date | Buyer | Sale Price | Title Company |
|---|---|---|---|
| Goodyear Terrance L | $106,500 | Fidelity National Title | |
| Remsen Edward E | $181,000 | Multiple | |
| Condon Lowell D | $130,300 | -- |
Source: Public Records
Mortgage History
| Date | Status | Borrower | Loan Amount |
|---|---|---|---|
| Open | Goodyear Terrance L | $84,900 | |
| Previous Owner | Remsen Edward E | $81,000 | |
| Closed | Condon Lowell D | -- |
Source: Public Records
Tax History
| Year | Tax Paid | Tax Assessment Tax Assessment Total Assessment is a certain percentage of the fair market value that is determined by local assessors to be the total taxable value of land and additions on the property. | Land | Improvement |
|---|---|---|---|---|
| 2024 | $6,083 | $86,591 | $14,769 | $71,822 |
| 2023 | $5,245 | $75,297 | $12,843 | $62,454 |
| 2022 | $5,245 | $69,080 | $11,783 | $57,297 |
| 2021 | $5,186 | $66,423 | $11,330 | $55,093 |
| 2020 | $5,054 | $64,488 | $11,000 | $53,488 |
| 2019 | $5,186 | $65,028 | $11,000 | $54,028 |
| 2018 | $5,058 | $58,271 | $14,544 | $43,727 |
| 2017 | $4,891 | $53,706 | $13,405 | $40,301 |
| 2016 | $4,671 | $50,906 | $12,706 | $38,200 |
| 2015 | $4,584 | $48,025 | $11,987 | $36,038 |
| 2014 | -- | $46,626 | $11,638 | $34,988 |
| 2013 | -- | $47,097 | $11,756 | $35,341 |
Source: Public Records
Map
Nearby Homes
- 616 Briarwood Ln
- 395 Danforth Dr
- 206 E Washington St
- 69 Monroe St
- 101 Bell Ct
- 238 Cooney Way
- 403 Tanya Ln
- 237 Cooney Way
- 236 Cooney Way
- 94 Templeton Dr
- 204 Dorset Ave
- 5055 U S 34
- 706 Springside Ct
- 285 Lakeshore Dr
- 851 Claridge Dr
- 509 Marty Ln
- 114 Riverview Ct
- 1451 Vintage Dr
- 668 Cumberland Ln
- 483 Deerfield Dr
- 444 Prairieview Dr
- 448 Prairieview Dr
- 442 Prairieview Dr
- 454 Prairieview Dr
- 450 Prairieview Dr
- 456 Prairieview Dr Unit 2
- 438 Prairieview Dr
- 436 Prairieview Dr
- 499 Creekside Ct
- 480 Lakeview Ct
- 432 Prairieview Dr
- 500 Creekside Ct
- 507 Lakeview Dr
- 501 Creekside Ct
- 451 Prairieview Dr Unit 2
- 449 Prairieview Dr
- 453 Prairieview Dr Unit 2
- 422 Prairieview Dr Unit 2
- 447 Prairieview Dr
- 506 Lakeview Dr