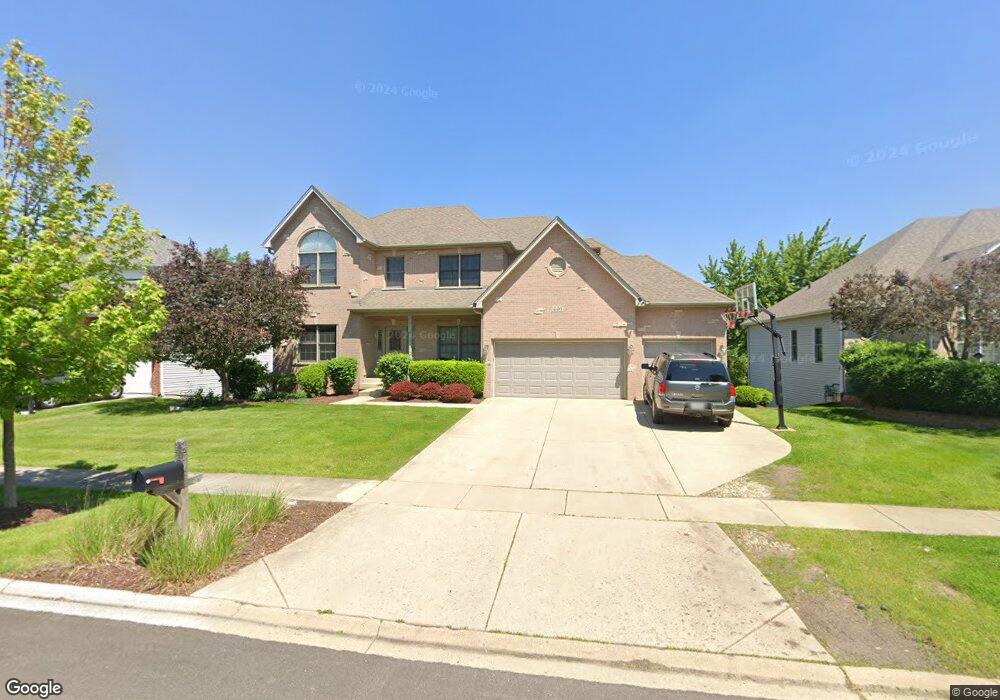
446 Sudbury Cir Unit 7 Oswego, IL 60543
South Oswego NeighborhoodEstimated Value: $549,095 - $610,000
4
Beds
3
Baths
3,038
Sq Ft
$192/Sq Ft
Est. Value
About This Home
This home is located at 446 Sudbury Cir Unit 7, Oswego, IL 60543 and is currently estimated at $584,024, approximately $192 per square foot. 446 Sudbury Cir Unit 7 is a home located in Kendall County with nearby schools including Prairie Point Elementary School, Traughber Junior High School, and Oswego High School.
Ownership History
Date
Name
Owned For
Owner Type
Purchase Details
Closed on
Nov 4, 2004
Sold by
T J Baumgartner Custom Homes Corp
Bought by
Massoth David M and Massoth Jennifer N
Current Estimated Value
Home Financials for this Owner
Home Financials are based on the most recent Mortgage that was taken out on this home.
Original Mortgage
$320,240
Outstanding Balance
$148,743
Interest Rate
4.75%
Mortgage Type
Purchase Money Mortgage
Estimated Equity
$435,281
Purchase Details
Closed on
Jul 21, 2003
Sold by
Deerpath Development Corp
Bought by
T J Baumgartner Custom Homes Corp
Home Financials for this Owner
Home Financials are based on the most recent Mortgage that was taken out on this home.
Original Mortgage
$250,000
Interest Rate
5.3%
Mortgage Type
Purchase Money Mortgage
Create a Home Valuation Report for This Property
The Home Valuation Report is an in-depth analysis detailing your home's value as well as a comparison with similar homes in the area
Home Values in the Area
Average Home Value in this Area
Purchase History
| Date | Buyer | Sale Price | Title Company |
|---|---|---|---|
| Massoth David M | $400,500 | Chicago Title Insurance Comp | |
| T J Baumgartner Custom Homes Corp | $287,000 | -- |
Source: Public Records
Mortgage History
| Date | Status | Borrower | Loan Amount |
|---|---|---|---|
| Open | Massoth David M | $320,240 | |
| Previous Owner | T J Baumgartner Custom Homes Corp | $250,000 |
Source: Public Records
Tax History Compared to Growth
Tax History
| Year | Tax Paid | Tax Assessment Tax Assessment Total Assessment is a certain percentage of the fair market value that is determined by local assessors to be the total taxable value of land and additions on the property. | Land | Improvement |
|---|---|---|---|---|
| 2024 | $12,789 | $164,920 | $33,912 | $131,008 |
| 2023 | $11,440 | $145,947 | $30,011 | $115,936 |
| 2022 | $11,440 | $132,679 | $27,283 | $105,396 |
| 2021 | $11,042 | $123,999 | $25,498 | $98,501 |
| 2020 | $10,921 | $121,568 | $24,998 | $96,570 |
| 2019 | $10,825 | $118,755 | $24,998 | $93,757 |
| 2018 | $11,086 | $119,452 | $18,948 | $100,504 |
| 2017 | $10,831 | $111,637 | $17,708 | $93,929 |
| 2016 | $10,649 | $108,385 | $17,192 | $91,193 |
| 2015 | $10,937 | $106,260 | $16,855 | $89,405 |
| 2014 | -- | $103,165 | $16,364 | $86,801 |
| 2013 | -- | $103,165 | $16,364 | $86,801 |
Source: Public Records
Map
Nearby Homes
- 406 Windsor Dr
- 609 Chestnut Dr
- 482 Deerfield Dr
- 483 Deerfield Dr
- 676 Cumberland Ln
- 538 Sudbury Cir
- 668 Cumberland Ln
- 673 Cumberland Ln
- 777 Dartmouth Ln
- 770 Dartmouth Ln
- 851 Claridge Dr
- 315 White Pines Ln
- 639 Vista Dr
- 716 Pinehurst Ln
- 714 Pinehurst Ln
- 318 Monica Ln
- 2489 Semillon St
- 2486 Semillon St
- 2319 Hirsch Dr
- 612 Murdock Place
- 444 Sudbury Cir Unit 7
- 448 Sudbury Cir
- 442 Sudbury Cir
- 450 Sudbury Cir
- 445 Sudbury Cir
- 447 Sudbury Cir Unit 7
- 443 Sudbury Cir
- 449 Sudbury Cir
- 452 Sudbury Cir
- 308 Morgan Valley Dr
- 440 Sudbury Cir Unit 7
- 310 Morgan Valley Dr
- 441 Sudbury Cir Unit 7
- 306 Morgan Valley Dr
- 451 Sudbury Cir
- 304 Morgan Valley Dr
- 454 Sudbury Cir Unit 7
- 312 Morgan Valley Dr
- 423 Sudbury Cir
- 421 Sudbury Cir