4462 Antigua Way Unit 201 Oxnard, CA 93035
Oxnard Shores NeighborhoodEstimated Value: $748,409 - $856,000
2
Beds
2
Baths
1,368
Sq Ft
$585/Sq Ft
Est. Value
About This Home
This home is located at 4462 Antigua Way Unit 201, Oxnard, CA 93035 and is currently estimated at $800,352, approximately $585 per square foot. 4462 Antigua Way Unit 201 is a home located in Ventura County with nearby schools including Christa Mcauliffe Elementary School, Oxnard High School, and St. Anthony's Elementary School.
Ownership History
Date
Name
Owned For
Owner Type
Purchase Details
Closed on
Jul 23, 2020
Sold by
Ackerman Peter B and Ackerman Laura K
Bought by
Ackerman Peter B and Ackerman Laura K
Current Estimated Value
Purchase Details
Closed on
Apr 16, 2014
Sold by
The 2002 Lemler Family Trust and Lemler Jonathan D
Bought by
Ackerman Peter B and Ackerman Laura K
Home Financials for this Owner
Home Financials are based on the most recent Mortgage that was taken out on this home.
Original Mortgage
$115,000
Outstanding Balance
$87,058
Interest Rate
4.23%
Mortgage Type
New Conventional
Estimated Equity
$713,294
Purchase Details
Closed on
Jan 15, 2004
Sold by
Lemler Jonathan D and Lemler Kathleen A
Bought by
Lemler Jonathan D and Lemler Kathleen A
Create a Home Valuation Report for This Property
The Home Valuation Report is an in-depth analysis detailing your home's value as well as a comparison with similar homes in the area
Home Values in the Area
Average Home Value in this Area
Purchase History
We collect this data history from publicly available records. To have your information removed, we recommend requesting removal directly through your county’s website.
| Date | Buyer | Sale Price | Title Company |
|---|---|---|---|
| Ackerman Peter B | -- | None Available | |
| Ackerman Peter B | $465,500 | Chicago Title Company | |
| Lemler Jonathan D | -- | -- |
Source: Public Records
Mortgage History
We collect this data history from publicly available records. To have your information removed, we recommend requesting removal directly through your county’s website.
| Date | Status | Borrower | Loan Amount |
|---|---|---|---|
| Open | Ackerman Peter B | $115,000 |
Source: Public Records
Tax History
| Year | Tax Paid | Tax Assessment Tax Assessment Total Assessment is a certain percentage of the fair market value that is determined by local assessors to be the total taxable value of land and additions on the property. | Land | Improvement |
|---|---|---|---|---|
| 2025 | $6,958 | $570,139 | $370,820 | $199,319 |
| 2024 | $6,958 | $558,960 | $363,549 | $195,411 |
| 2023 | $6,706 | $548,000 | $356,420 | $191,580 |
| 2022 | $6,505 | $537,255 | $349,431 | $187,824 |
| 2021 | $6,454 | $526,721 | $342,579 | $184,142 |
| 2020 | $6,573 | $521,321 | $339,067 | $182,254 |
| 2019 | $6,389 | $511,100 | $332,419 | $178,681 |
| 2018 | $6,300 | $501,079 | $325,901 | $175,178 |
| 2017 | $5,981 | $491,255 | $319,511 | $171,744 |
| 2016 | $5,773 | $481,624 | $313,247 | $168,377 |
| 2015 | $5,834 | $474,392 | $308,543 | $165,849 |
| 2014 | $3,117 | $251,450 | $62,877 | $188,573 |
Source: Public Records
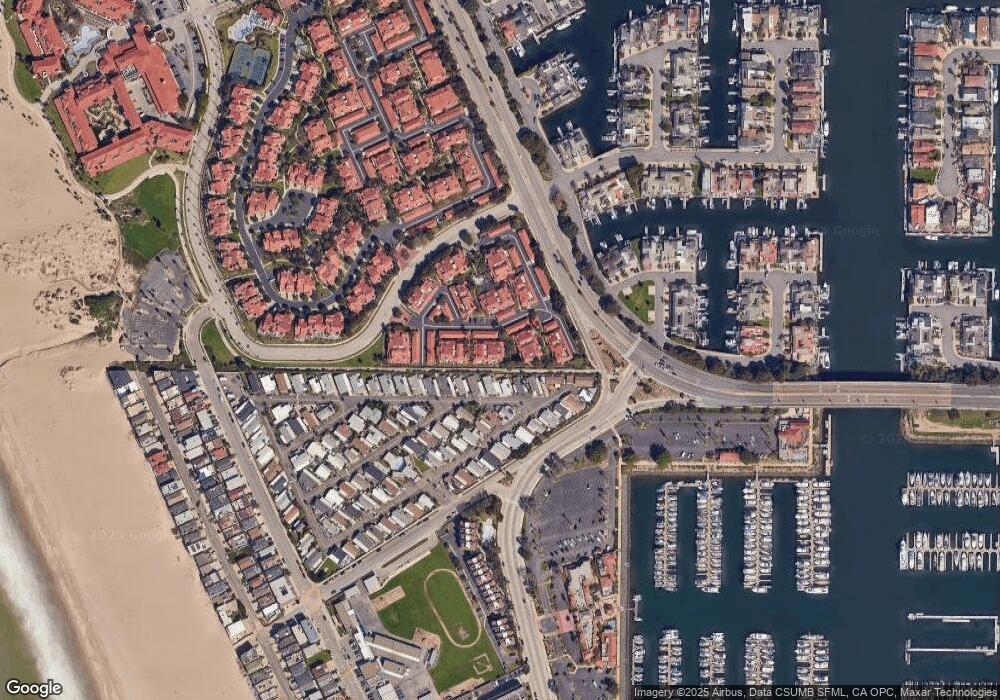
Map
Nearby Homes
- 4445 Antigua Way
- 4427 Antigua Way
- 4481 Antigua Way
- 4501 W Channel Islands Blvd Unit 43
- 2277 Martinique Ln
- 2835 Harbor Blvd
- 2325 Kingsbridge Ln
- 2845 Harbor Blvd
- 2202 Martinique Ln
- 4045 Sunset Ln
- 2955 Harbor Blvd Unit 112
- 2145 Kingsbridge Way
- 3107 Harbor Blvd
- 2230 Jamestown Ln
- 3141 Harbor Blvd Unit 30
- 3933 Sunset Ln
- 2010 Kingsbridge Way
- 4574 Gateshead Bay
- 2355 Peninsula Rd
- 4575 Gateshead Bay
- 4464 Antigua Way
- 4466 Antigua Way Unit 204
- 4460 Antigua Way
- 4462 Antigua Way
- 4470 Antigua Way
- 4472 Antigua Way
- 4474 Antigua Way
- 4444 Antigua Way Unit 197
- 4444 Antigua Way
- 4446 Antigua Way
- 4450 Antigua Way Unit 196
- 4452 Antigua Way
- 4450 Antigua Way
- 4442 Antigua Way
- 4440 Antigua Way
- 4486 Antigua Way
- 4456 Antigua Way
- 4454 Antigua Way
- 4484 Antigua Way
- 4480 Antigua Way
Your Personal Tour Guide
Ask me questions while you tour the home.