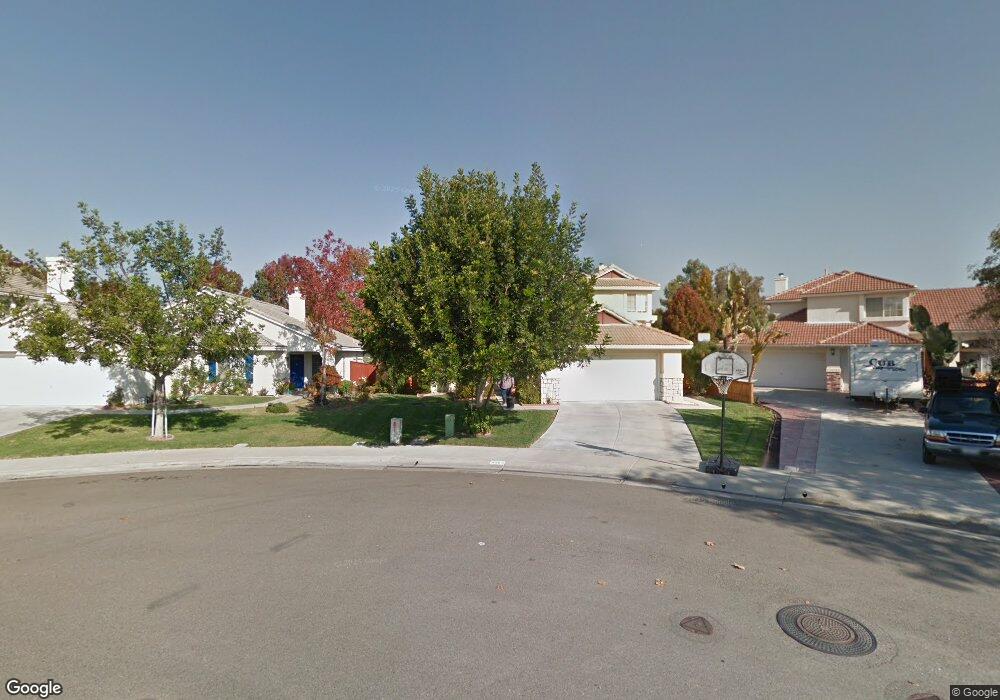
4465 Arbor Cove Cir Oceanside, CA 92058
North Valley NeighborhoodEstimated Value: $907,705 - $991,000
4
Beds
3
Baths
1,955
Sq Ft
$488/Sq Ft
Est. Value
About This Home
This home is located at 4465 Arbor Cove Cir, Oceanside, CA 92058 and is currently estimated at $953,926, approximately $487 per square foot. 4465 Arbor Cove Cir is a home located in San Diego County with nearby schools including Louise Foussat Elementary School, Martin Luther King Jr. Middle School, and El Camino High School.
Ownership History
Date
Name
Owned For
Owner Type
Purchase Details
Closed on
Jul 6, 2007
Sold by
Schwarzel John and Schwarzel Divina S
Bought by
Schwarzel John Joseph and Schwarzel Divina Sison
Current Estimated Value
Purchase Details
Closed on
Dec 21, 1998
Sold by
Schwarzel John
Bought by
Schwarzel John and Schwarzel Divina S
Home Financials for this Owner
Home Financials are based on the most recent Mortgage that was taken out on this home.
Original Mortgage
$167,850
Outstanding Balance
$38,555
Interest Rate
6.91%
Mortgage Type
VA
Estimated Equity
$915,371
Purchase Details
Closed on
Dec 12, 1996
Sold by
Schwarzel Divina Sison
Bought by
Schwarzel John
Home Financials for this Owner
Home Financials are based on the most recent Mortgage that was taken out on this home.
Original Mortgage
$166,249
Interest Rate
7.86%
Mortgage Type
VA
Create a Home Valuation Report for This Property
The Home Valuation Report is an in-depth analysis detailing your home's value as well as a comparison with similar homes in the area
Home Values in the Area
Average Home Value in this Area
Purchase History
| Date | Buyer | Sale Price | Title Company |
|---|---|---|---|
| Schwarzel John Joseph | -- | None Available | |
| Schwarzel John | -- | Commonwealth Land Title Co | |
| Schwarzel John | -- | California Title Company | |
| Schwarzel John | $163,000 | Orange Coast Title Company |
Source: Public Records
Mortgage History
| Date | Status | Borrower | Loan Amount |
|---|---|---|---|
| Open | Schwarzel John | $167,850 | |
| Previous Owner | Schwarzel John | $166,249 |
Source: Public Records
Tax History
| Year | Tax Paid | Tax Assessment Tax Assessment Total Assessment is a certain percentage of the fair market value that is determined by local assessors to be the total taxable value of land and additions on the property. | Land | Improvement |
|---|---|---|---|---|
| 2025 | $3,051 | $270,183 | $56,986 | $213,197 |
| 2024 | $3,051 | $264,886 | $55,869 | $209,017 |
| 2023 | $2,957 | $259,693 | $54,774 | $204,919 |
| 2022 | $2,910 | $254,601 | $53,700 | $200,901 |
| 2021 | $2,917 | $249,610 | $52,648 | $196,962 |
| 2020 | $2,829 | $247,052 | $52,109 | $194,943 |
| 2019 | $2,747 | $242,209 | $51,088 | $191,121 |
| 2018 | $2,716 | $237,461 | $50,087 | $187,374 |
| 2017 | $2,664 | $232,805 | $49,105 | $183,700 |
| 2016 | $2,534 | $224,242 | $48,143 | $176,099 |
| 2015 | $2,460 | $220,874 | $47,420 | $173,454 |
| 2014 | $2,368 | $216,549 | $46,492 | $170,057 |
Source: Public Records
Map
Nearby Homes
- 4475 Saint Andrews Place
- 638 Sumner Way Unit 4
- 4413 Point Degada
- 4499 Pebble Beach Dr
- 4422 Point Degada
- 625 Sumner Way Unit 4
- 4484 Brisbane Way Unit 3
- 4467 Anne Sladon St
- 4588 Vinyard St
- 318 Festival Dr
- 156 Avenida Descanso
- 4560 Calle Del Palo
- 4616 N River Rd Unit 89
- 505 Portico Dr
- 265 Securidad St
- 231 Riverview Way
- 4660 N River Rd Unit 150
- 4660 N River Rd Unit 116
- 4660 N River Rd Unit 136
- 4660 N River Rd Unit 17
- 4469 Arbor Cove Cir
- 4461 Arbor Cove Cir
- 4457 Arbor Cove Cir
- 4473 Arbor Cove Cir
- 711 Point Arguello Unit 1
- 715 Point Arguello Unit 1
- 4453 Arbor Cove Cir
- 4477 Arbor Cove Cir
- 702 Point Reyes
- 719 Point Arguello
- 4470 Arbor Cove Cir
- 4449 Arbor Cove Cir
- 723 Point Arguello
- 4481 Arbor Cove Cir
- 4474 Arbor Cove Cir
- 4446 Arbor Cove Cir
- 706 Point Reyes
- 4445 Arbor Cove Cir
- 727 Point Arguello
- 697 Sunningdale Dr
Your Personal Tour Guide
Ask me questions while you tour the home.