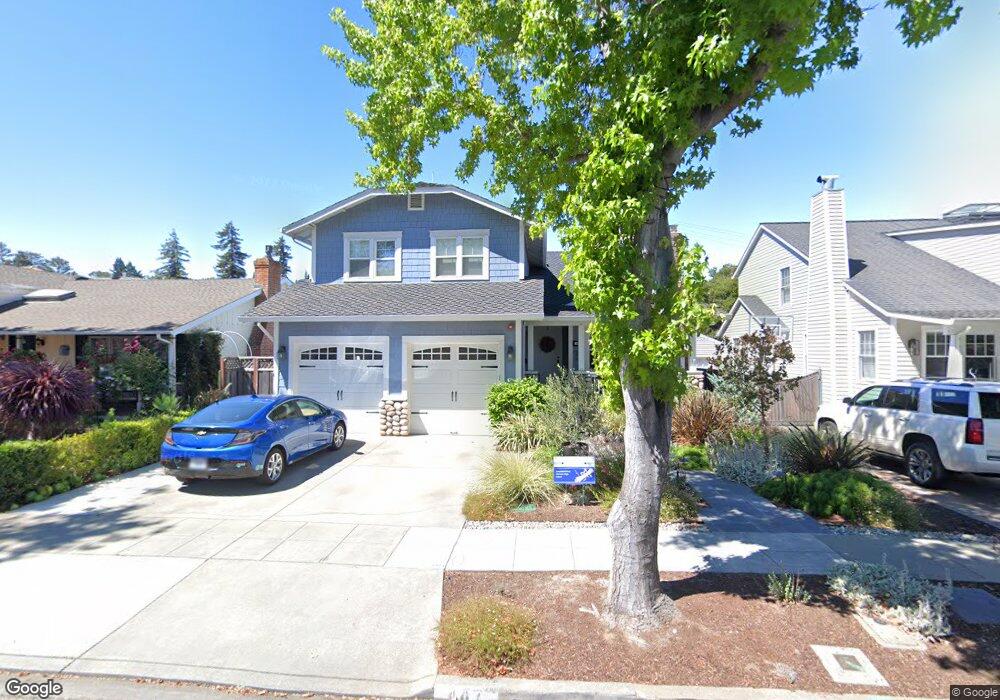
447 Chatham Rd Burlingame, CA 94010
Oak Grove Manor NeighborhoodEstimated Value: $2,879,000 - $3,795,000
4
Beds
3
Baths
2,360
Sq Ft
$1,363/Sq Ft
Est. Value
About This Home
This home is located at 447 Chatham Rd, Burlingame, CA 94010 and is currently estimated at $3,216,212, approximately $1,362 per square foot. 447 Chatham Rd is a home located in San Mateo County with nearby schools including Washington Elementary School, Burlingame Intermediate School, and Burlingame High School.
Ownership History
Date
Name
Owned For
Owner Type
Purchase Details
Closed on
Jun 21, 2011
Sold by
Ducker James Keith and Kroenlein Johanna M
Bought by
Mathews Brian P and Mathews Lauren W
Current Estimated Value
Home Financials for this Owner
Home Financials are based on the most recent Mortgage that was taken out on this home.
Original Mortgage
$620,000
Interest Rate
4.54%
Mortgage Type
New Conventional
Purchase Details
Closed on
Feb 6, 2008
Sold by
Ruhl Sylvia A
Bought by
Ducker James Keith and Kroenlein Johanna M
Home Financials for this Owner
Home Financials are based on the most recent Mortgage that was taken out on this home.
Original Mortgage
$122,500
Interest Rate
5.64%
Mortgage Type
Credit Line Revolving
Purchase Details
Closed on
Sep 16, 1995
Sold by
Ruhl Rudolph C and Ruhl Sylvia A
Bought by
Ruhl Rudolph C and Ruhl Sylvia A
Create a Home Valuation Report for This Property
The Home Valuation Report is an in-depth analysis detailing your home's value as well as a comparison with similar homes in the area
Home Values in the Area
Average Home Value in this Area
Purchase History
| Date | Buyer | Sale Price | Title Company |
|---|---|---|---|
| Mathews Brian P | $1,475,000 | Fidelity National Title Co | |
| Ducker James Keith | $1,225,000 | Fidelity National Title Co | |
| Ruhl Rudolph C | -- | -- |
Source: Public Records
Mortgage History
| Date | Status | Borrower | Loan Amount |
|---|---|---|---|
| Previous Owner | Mathews Brian P | $620,000 | |
| Previous Owner | Ducker James Keith | $122,500 | |
| Previous Owner | Ducker James Keith | $980,000 |
Source: Public Records
Tax History
| Year | Tax Paid | Tax Assessment Tax Assessment Total Assessment is a certain percentage of the fair market value that is determined by local assessors to be the total taxable value of land and additions on the property. | Land | Improvement |
|---|---|---|---|---|
| 2025 | $20,739 | $1,852,676 | $926,338 | $926,338 |
| 2023 | $20,739 | $1,780,736 | $890,368 | $890,368 |
| 2022 | $20,002 | $1,745,820 | $872,910 | $872,910 |
| 2021 | $20,031 | $1,711,590 | $855,795 | $855,795 |
| 2020 | $19,616 | $1,694,040 | $847,020 | $847,020 |
| 2019 | $19,180 | $1,660,824 | $830,412 | $830,412 |
| 2018 | $18,816 | $1,628,260 | $814,130 | $814,130 |
| 2017 | $18,679 | $1,596,334 | $798,167 | $798,167 |
| 2016 | $17,993 | $1,565,034 | $782,517 | $782,517 |
| 2015 | $17,914 | $1,541,526 | $770,763 | $770,763 |
| 2014 | $17,654 | $1,511,330 | $755,665 | $755,665 |
Source: Public Records
Map
Nearby Homes
- 728 Laurel Ave
- 743 Winchester Dr
- 200 Anita Rd
- 1110 Bayswater Ave Unit 106
- 518 Almer Rd Unit 6
- 525 Almer Rd Unit 106
- 1515 Floribunda Ave Unit 309
- 320 Peninsula Ave Unit 316
- 215 Victoria Rd
- 608 Peninsula Ave
- 871 Woodside Way
- 869 Woodside Way
- 422 Peninsula Ave
- 114 Bayswater Ave
- 735 El Camino Real Unit 102
- 735 El Camino Real Unit 104
- 10 Channing Rd
- 1421 Palm Dr
- 1012 N Humboldt St Unit N
- 1515 Arc Way Unit 105
Your Personal Tour Guide
Ask me questions while you tour the home.