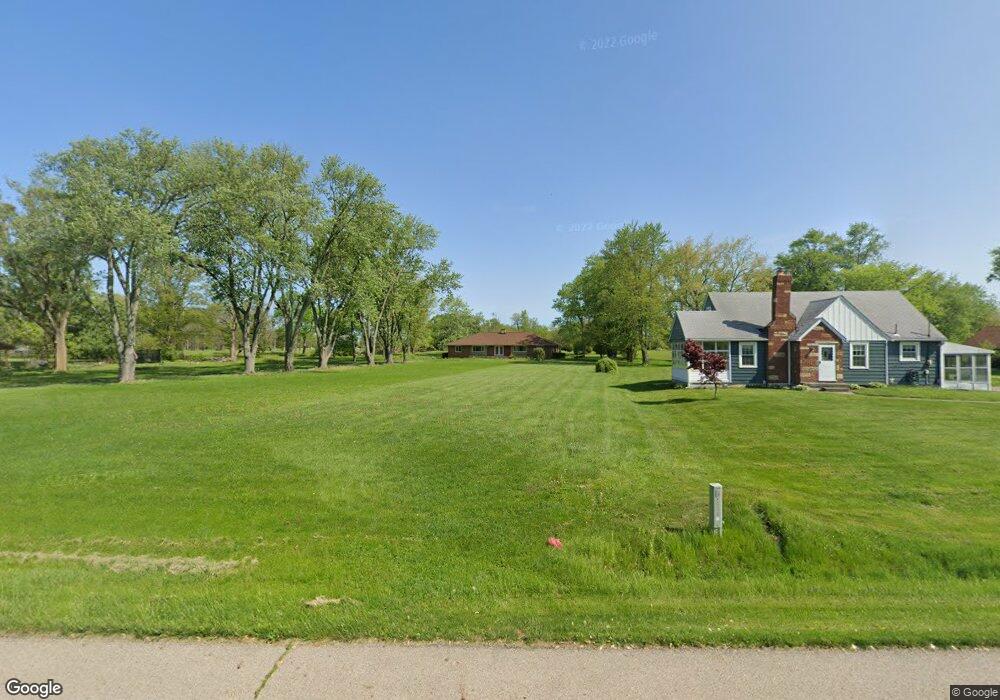
4474 W National Rd Springfield, OH 45504
Cedar Hills/Broadview NeighborhoodEstimated Value: $164,000 - $332,221
4
Beds
2
Baths
2,300
Sq Ft
$106/Sq Ft
Est. Value
About This Home
This home is located at 4474 W National Rd, Springfield, OH 45504 and is currently estimated at $243,555, approximately $105 per square foot. 4474 W National Rd is a home located in Clark County with nearby schools including Shawnee Middle School/High School, Springfield Christian School, and Maiden Lane Christian Educare.
Ownership History
Date
Name
Owned For
Owner Type
Purchase Details
Closed on
Apr 16, 2013
Sold by
Us Bank Na
Bought by
Spencer Gloria J
Current Estimated Value
Purchase Details
Closed on
Feb 11, 2013
Sold by
Oconnell Tracy D
Bought by
U S Bank National Association
Purchase Details
Closed on
May 24, 2010
Sold by
Miller Andrew T
Bought by
Oconnell Tracy D
Purchase Details
Closed on
Oct 27, 2006
Sold by
Oconnell Tracy D
Bought by
Oconnell Tracy D and Miller Andrew T
Home Financials for this Owner
Home Financials are based on the most recent Mortgage that was taken out on this home.
Original Mortgage
$193,500
Interest Rate
6.41%
Mortgage Type
Balloon
Purchase Details
Closed on
Sep 18, 2003
Sold by
Steffee Brian D and Steffee Teresa A
Bought by
Oconnell Tracy D
Home Financials for this Owner
Home Financials are based on the most recent Mortgage that was taken out on this home.
Original Mortgage
$174,000
Interest Rate
9.99%
Mortgage Type
Purchase Money Mortgage
Create a Home Valuation Report for This Property
The Home Valuation Report is an in-depth analysis detailing your home's value as well as a comparison with similar homes in the area
Home Values in the Area
Average Home Value in this Area
Purchase History
| Date | Buyer | Sale Price | Title Company |
|---|---|---|---|
| Spencer Gloria J | $60,700 | None Available | |
| U S Bank National Association | $92,000 | None Available | |
| Oconnell Tracy D | -- | None Available | |
| Oconnell Tracy D | $85,100 | Triad Title Agency | |
| Oconnell Tracy D | $174,000 | -- |
Source: Public Records
Mortgage History
| Date | Status | Borrower | Loan Amount |
|---|---|---|---|
| Previous Owner | Oconnell Tracy D | $193,500 | |
| Previous Owner | Oconnell Tracy D | $174,000 |
Source: Public Records
Tax History Compared to Growth
Tax History
| Year | Tax Paid | Tax Assessment Tax Assessment Total Assessment is a certain percentage of the fair market value that is determined by local assessors to be the total taxable value of land and additions on the property. | Land | Improvement |
|---|---|---|---|---|
| 2024 | $2,264 | $55,350 | $20,340 | $35,010 |
| 2023 | $2,264 | $55,350 | $20,340 | $35,010 |
| 2022 | $2,266 | $55,350 | $20,340 | $35,010 |
| 2021 | $2,544 | $55,630 | $15,760 | $39,870 |
| 2020 | $2,565 | $55,630 | $15,760 | $39,870 |
| 2019 | $2,605 | $55,630 | $15,760 | $39,870 |
| 2018 | $2,535 | $53,760 | $14,330 | $39,430 |
| 2017 | $2,598 | $53,757 | $14,329 | $39,428 |
| 2016 | $2,345 | $53,757 | $14,329 | $39,428 |
| 2015 | $2,346 | $52,283 | $14,329 | $37,954 |
| 2014 | $2,353 | $52,283 | $14,329 | $37,954 |
| 2013 | $2,455 | $52,283 | $14,329 | $37,954 |
Source: Public Records
Map
Nearby Homes
- 4461 New Carlisle Pike
- 245 Gordon Rd
- 5095 W National Rd
- 224 E Downey Dr
- 323 Saint Paul Ave
- 5171 New Carlisle Pike
- 3721 W National Rd
- 124 Old Mill Rd
- 4904 Alpha Rd
- 601 Hornwood Dr
- 570 Aberfelda Dr
- 201 Beech Dr
- 190 Oakridge Dr
- 3161 Dayton Springfield Rd
- 3161 Dayton Rd
- 1290 Red Oaks Cir
- 1616 Crest Dr
- 6105 New Carlisle Pike
- 1810 Old Mill Rd
- 5520 Old Lower Valley Park
- 0 Kingsgate Lot 18476
- 4450 W National Rd
- 4436 W National Rd
- 4490 W National Rd
- 4412 W National Rd
- 4528 W National Rd
- 4536 W National Rd
- 4459 W National Rd
- 4421 W National Rd
- 4483 W National Rd
- 4503 W National Rd
- 4365 W National Rd
- 4529 W National Rd
- 4557 W National Rd
- 4315 W National Rd
- 4622 W National Rd
- 0 Victory Rd
- 1 Victory Rd
- 25 King Tree Ln
- 4638 W National Rd