Estimated Value: $638,000 - $668,842
5
Beds
3
Baths
1,690
Sq Ft
$385/Sq Ft
Est. Value
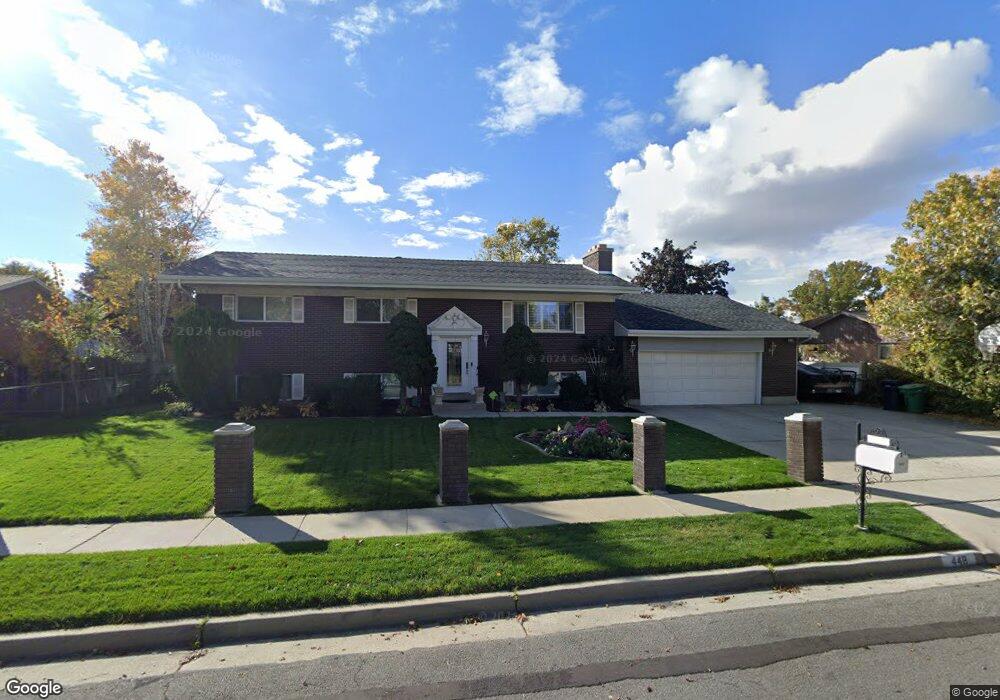
About This Home
This home is located at 448 Howard Dr, Sandy, UT 84070 and is currently estimated at $650,711, approximately $385 per square foot. 448 Howard Dr is a home located in Salt Lake County with nearby schools including Mount Jordan Middle School and Jordan High.
Ownership History
Date
Name
Owned For
Owner Type
Purchase Details
Closed on
Apr 18, 2003
Sold by
Robison Warren S and Robison Joanne A
Bought by
Robison Warren S and Robison Joanne A
Current Estimated Value
Home Financials for this Owner
Home Financials are based on the most recent Mortgage that was taken out on this home.
Original Mortgage
$74,000
Interest Rate
4.86%
Purchase Details
Closed on
May 29, 1996
Sold by
Robison Warren S
Bought by
Robison Warren S and Robison Joanne A
Create a Home Valuation Report for This Property
The Home Valuation Report is an in-depth analysis detailing your home's value as well as a comparison with similar homes in the area
Home Values in the Area
Average Home Value in this Area
Purchase History
| Date | Buyer | Sale Price | Title Company |
|---|---|---|---|
| Robison Warren S | -- | Surety Title | |
| Robison Warren S | -- | Surety Title | |
| Robison Warren S | -- | -- |
Source: Public Records
Mortgage History
| Date | Status | Borrower | Loan Amount |
|---|---|---|---|
| Closed | Robison Warren S | $74,000 |
Source: Public Records
Tax History
| Year | Tax Paid | Tax Assessment Tax Assessment Total Assessment is a certain percentage of the fair market value that is determined by local assessors to be the total taxable value of land and additions on the property. | Land | Improvement |
|---|---|---|---|---|
| 2025 | -- | $650,200 | $202,800 | $447,400 |
| 2024 | -- | $630,400 | $197,200 | $433,200 |
| 2023 | $3,169 | $552,100 | $187,400 | $364,700 |
| 2022 | $3,169 | $570,900 | $120,800 | $450,100 |
| 2021 | $3,723 | $435,200 | $92,600 | $342,600 |
| 2020 | $2,709 | $391,700 | $92,600 | $299,100 |
| 2019 | $2,572 | $362,400 | $87,400 | $275,000 |
Source: Public Records
Map
Nearby Homes
- 487 E 9270 S
- 566 E 9270 S
- 186 Brent Cir
- 9822 S Darin Dr
- 362 E 9150 S
- 181 E 9180 S
- 9218 S Laura Anne Way
- 807 E Whisper Cove Rd
- 9092 Enchanted Oak Ln
- 9101 S Enchanted Oak Ln
- 918 Lazon Dr
- 10106 S Peony Way
- 37 Crawford Place
- 8750 S 500 E
- 8812 S Cy's Park Ln Unit 6
- 8807 S Cy's Park Ln E Unit 1
- 8806 S Cy's Park Ln E Unit 4
- 8808 S Cy's Park Unit 5
- 8475 S State St
- 9587 S 1040 E
Your Personal Tour Guide
Ask me questions while you tour the home.