NOT LISTED FOR SALE

Estimated Value: $193,560 - $231,000

3 Beds
2 Baths
1,680 Sq Ft
$126/Sq Ft Est. Value

Last Sold May 22, 2015

Last sale price $115,000 $68 Per Sq Ft

Est. 84% increase in value since last sale

Current estimated payment $1,288/month

About This Home

As of May 2015

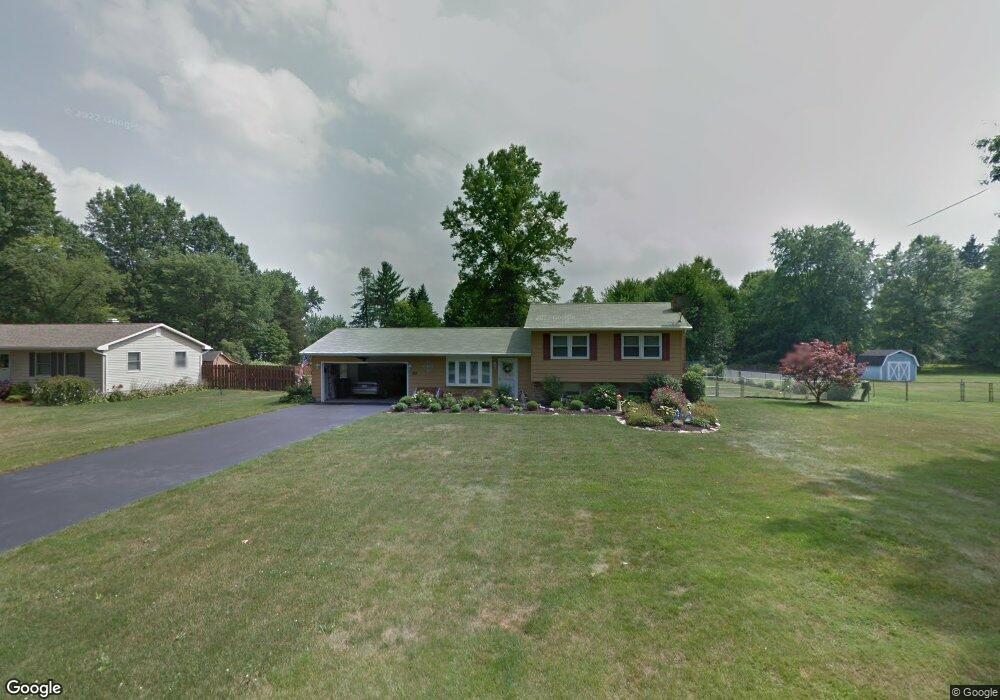
Immaculate 3 bedroom Split Level. Updated eat-in kitchen features maple cabinets, ceramic flooring with plenty of room to move around, sunken family room with gas fireplace leads to a vinyl deck overlooking large fenced in yard. Large MBR with Pergo flooring as well as 2nd & 3rd bedroom. Attached 2 car garage with opener. Don't buy a house until you have seen this one!

Ownership History

Date Name Owned For Owner Type

Purchase Details

Listed on
Mar 5, 2015
Closed on
May 19, 2015
Sold by
Pusic Karen
Bought by
Hall Mark D and Hall Kimberly M
Seller's Agent
Virginia Jones
Deleted Agent
Buyer's Agent
Kimberly Myers
Deleted Agent
List Price
$115,000
Sold Price
$115,000
Current Estimated Value
$211,890

Home Financials for this Owner

Home Financials are based on the most recent Mortgage that was taken out on this home.
Estimated Appreciation
$96,890
Avg. Annual Appreciation
6.02%
Original Mortgage
$106,837
Outstanding Balance
$82,124
Interest Rate
3.62%
Mortgage Type
FHA
Estimated Equity
$129,766

Purchase Details

Closed on
May 21, 1985
Bought by
Jones Patricia A
Source: Public Records

Range of Values:

Collateral Analytics

Collateral Analytics Collateral Analytics AVMs (Automated Valuation Model) employ a number of statistical approaches combined with neighborhood-specific comparable selection guarantees the most up-to-date and precise valuations.

Not Available

Collateral Analytics does not have data for the current month. Please view the chart for historical values.

ICE

ICE Mortgage Technology ICE Mortgage Technology’s AVM (Automated Valuation Model) is a state-of-the-art online residential property valuation tool that provides a quick and accurate estimate of the value of almost any home in the U.S.

Not Available

ICE Mortgage Technology does not have data for the current month. Please view the chart for historical values.

First American

First American First American Data & Analytics’ next-generation AVM combines unrivaled data assets with a blended ensemble of valuation models to produce highly accurate, reliable valuations you can trust.

Not Available

First American does not have data for the current month. Please view the chart for historical values.

Quantarium

Quantarium Quantarium’s valuation service, repeatedly proven the industry’s most accurate and comprehensive, is supercharged with a self-learning and auto-tuning AI engine that continually becomes smarter and more accurate as it processes daily inputs from the industry’s leading RE data lake.

Not Available

Quantarium does not have data for the current month. Please view the chart for historical values.

Average Value
Not Available
List Price
Sold Price
Create a Home Valuation Report for This Property
The Home Valuation Report is an in-depth analysis detailing your home's value as well as a comparison with similar homes in the area

Home Values in the Area

Source: Public Records

Average Home Value in this Area


Source: Public Records

Purchase History

Date Buyer Sale Price Title Company
Hall Mark D $115,000 Attorney
Jones Patricia A $53,000 --
Source: Public Records

Mortgage History

Date Status Borrower Loan Amount
Open Hall Mark D $106,837
Source: Public Records

Property History

Date Event Price List to Sale Price per Sq Ft Prior Sale
05/22/2015 05/22/15 Sold $115,000 0.0% $68 / Sq Ft View Prior Sale
03/23/2015 03/23/15 Pending -- -- --
03/05/2015 03/05/15 For Sale $115,000 -- $68 / Sq Ft

Tax History Compared to Growth

Source: Public Records

Tax History

Year Tax Paid Tax Assessment Tax Assessment Total Assessment is a certain percentage of the fair market value that is determined by local assessors to be the total taxable value of land and additions on the property. Land Improvement
2024 $2,120 $45,740 $6,550 $39,190
2023 $2,082 $45,740 $6,550 $39,190
2022 $2,247 $39,610 $5,640 $33,970
2021 $2,249 $39,610 $5,640 $33,970
2020 $2,258 $39,610 $5,640 $33,970
2019 $2,133 $33,710 $5,640 $28,070
2018 $2,054 $33,710 $5,640 $28,070
2017 $1,441 $33,710 $5,640 $28,070
2016 $1,372 $31,170 $5,640 $25,530
2015 $1,332 $31,170 $5,640 $25,530
2014 $1,337 $31,170 $5,640 $25,530
2013 $1,322 $31,170 $5,640 $25,530
Source: Public Records

Agents Affiliated with this Home

See All Agents

Map