Estimated Value: $752,000 - $1,061,923
3
Beds
3
Baths
2,992
Sq Ft
$307/Sq Ft
Est. Value
About This Home
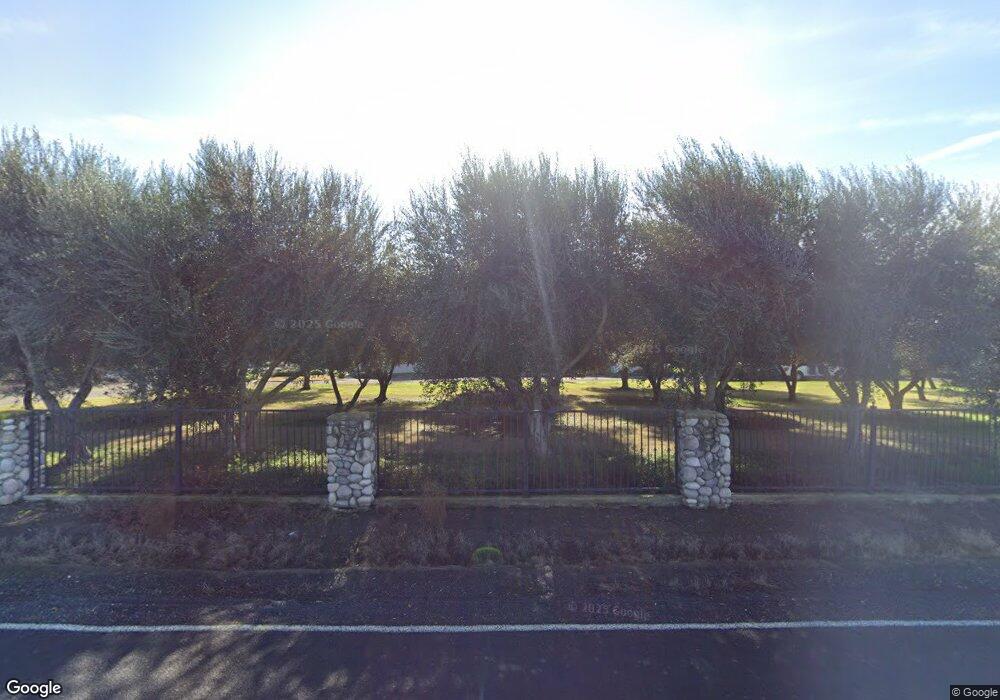
This home is located at 4484 Tredway Rd, Lodi, CA 95242 and is currently estimated at $917,974, approximately $306 per square foot. 4484 Tredway Rd is a home located in San Joaquin County with nearby schools including Ellerth E. Larson Elementary School, Lodi Middle School, and Tokay High School.
Ownership History
Date
Name
Owned For
Owner Type
Purchase Details
Closed on
Nov 12, 2020
Sold by
Costa Patrick and The Pc Trust
Bought by
C & C Farms Lp
Current Estimated Value
Home Financials for this Owner
Home Financials are based on the most recent Mortgage that was taken out on this home.
Original Mortgage
$235,000
Outstanding Balance
$209,117
Interest Rate
2.8%
Mortgage Type
Commercial
Estimated Equity
$708,857
Purchase Details
Closed on
Feb 10, 2012
Sold by
Costa Patrick
Bought by
C & C Farms Lp
Purchase Details
Closed on
Jan 24, 2012
Sold by
C & C Farms Lp
Bought by
Costa Patrick
Purchase Details
Closed on
Oct 7, 2005
Sold by
Costa Patrick
Bought by
C & C Farms Lp
Purchase Details
Closed on
Sep 6, 2005
Sold by
C & C Farms Lp
Bought by
Costa Patrick
Purchase Details
Closed on
Dec 11, 2001
Sold by
Costa Louis L and Costa Patrick
Bought by
C & C Farms Lp
Create a Home Valuation Report for This Property
The Home Valuation Report is an in-depth analysis detailing your home's value as well as a comparison with similar homes in the area
Purchase History
| Date | Buyer | Sale Price | Title Company |
|---|---|---|---|
| C & C Farms Lp | -- | Chicago Title Company | |
| Costa Patrick | -- | Chicago Title Company | |
| C & C Farms Lp | -- | First American Title Company | |
| Costa Patrick | -- | First American Title Company | |
| C & C Farms Lp | -- | Fidelity Natl Title Ins Co | |
| Costa Patrick | -- | Fidelity Natl Title Ins Co | |
| C & C Farms Lp | -- | -- | |
| Costa Louis L | -- | -- |
Source: Public Records
Mortgage History
| Date | Status | Borrower | Loan Amount |
|---|---|---|---|
| Open | Costa Patrick | $235,000 |
Source: Public Records
Tax History
| Year | Tax Paid | Tax Assessment Tax Assessment Total Assessment is a certain percentage of the fair market value that is determined by local assessors to be the total taxable value of land and additions on the property. | Land | Improvement |
|---|---|---|---|---|
| 2025 | $6,811 | $570,732 | $208,572 | $362,160 |
| 2024 | $6,719 | $566,774 | $213,261 | $353,513 |
| 2023 | $6,658 | $556,531 | $211,179 | $345,352 |
| 2022 | $6,483 | $541,854 | $202,942 | $338,912 |
| 2021 | $6,684 | $539,801 | $197,263 | $342,538 |
| 2020 | $5,963 | $536,115 | $199,837 | $336,278 |
| 2019 | $5,843 | $525,603 | $195,919 | $329,684 |
| 2018 | $5,762 | $515,298 | $192,077 | $323,221 |
| 2017 | $5,583 | $500,612 | $155,530 | $345,082 |
| 2016 | $5,210 | $488,492 | $140,220 | $348,272 |
| 2014 | $5,110 | $475,613 | $121,019 | $354,594 |
Source: Public Records
Map
Nearby Homes
- 14275 N Neeley Rd
- 23181 Devries Rd
- 3587 W Sargent Rd
- 4175 W Sargent Rd
- 5379 Ridgeview Cir
- 5224 Vesta Cir
- 5222 Loki Ln
- 5914 Silver Oak Cir
- 10703 Pleasant Valley Cir
- 10816 Merritt Dr
- 3144 Sweet Lilac Way
- 5849 Silveroak Cir
- 1647 Marigold Way
- 481 W Highway 12
- 2911 Zinnia Way
- 2905 Zinnia Way
- 2011 Evening St
- 1820 Van Ruiten Dr
- 2013 Van Ruiten Dr
- 12373 N Lower Sacramento Rd
- 13199 N Ray Rd
- 13810 N Ray Rd
- 3750 Tredway Rd
- 13555 N Neeley Rd
- 13833 Royal Rd
- 13649 N Neeley Rd
- 13721 N Neeley Rd
- 13222 N Neeley Rd
- 13833 N Neeley Rd
- 13859 N Neeley Rd
- 4040 W Kingdon Rd
- 13846 N Neeley Rd
- 4289 W Kingdon Rd
- 4385 W Kingdon Rd
- 4225 W Kingdon Rd
- 4205 W Kingdon Rd
- 4471 W Kingdon Rd
- 3838 W Kingdon Rd
- 14200 N Ray Rd
- 14250 N Ray Rd