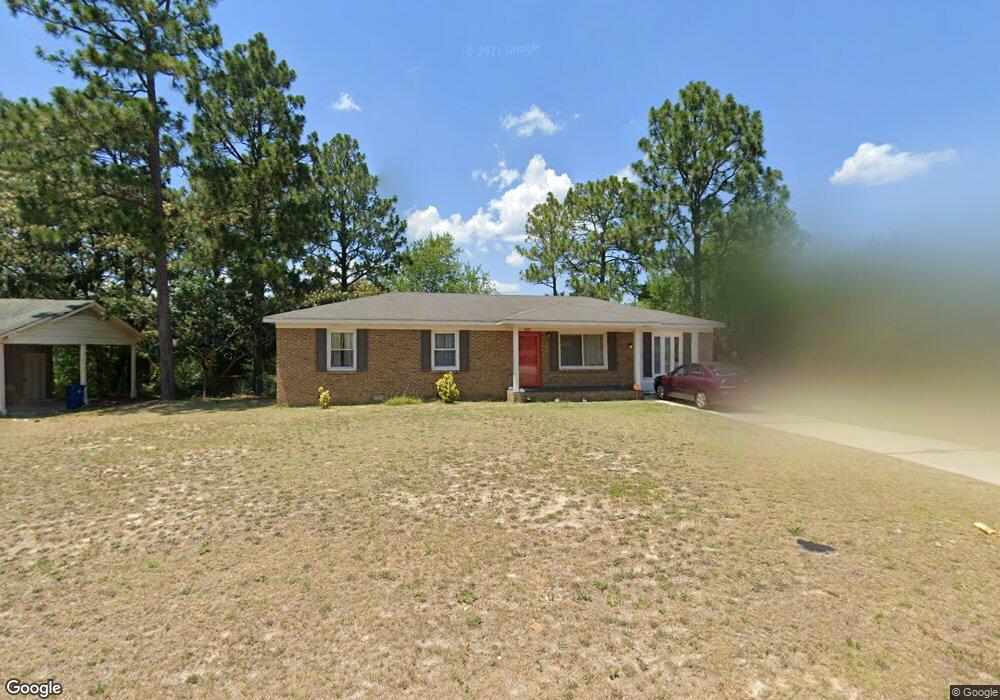
4489 Ruby Rd Fayetteville, NC 28311
Kings Grant NeighborhoodEstimated Value: $158,000 - $192,049
3
Beds
2
Baths
1,422
Sq Ft
$123/Sq Ft
Est. Value
About This Home
This home is located at 4489 Ruby Rd, Fayetteville, NC 28311 and is currently estimated at $175,262, approximately $123 per square foot. 4489 Ruby Rd is a home located in Cumberland County with nearby schools including Warrenwood Elementary, Spring Lake Middle, and E. E. Smith High School.
Ownership History
Date
Name
Owned For
Owner Type
Purchase Details
Closed on
Oct 30, 2009
Sold by
Plewes Gary W
Bought by
Godfrey Barbara A
Current Estimated Value
Home Financials for this Owner
Home Financials are based on the most recent Mortgage that was taken out on this home.
Original Mortgage
$84,343
Outstanding Balance
$54,428
Interest Rate
5.01%
Mortgage Type
FHA
Estimated Equity
$120,834
Purchase Details
Closed on
Feb 29, 2000
Sold by
Denson Oscar H
Bought by
Hicks Redd Jacqueline
Home Financials for this Owner
Home Financials are based on the most recent Mortgage that was taken out on this home.
Original Mortgage
$63,466
Interest Rate
8.29%
Create a Home Valuation Report for This Property
The Home Valuation Report is an in-depth analysis detailing your home's value as well as a comparison with similar homes in the area
Home Values in the Area
Average Home Value in this Area
Purchase History
| Date | Buyer | Sale Price | Title Company |
|---|---|---|---|
| Godfrey Barbara A | $86,000 | -- | |
| Hicks Redd Jacqueline | $63,500 | -- |
Source: Public Records
Mortgage History
| Date | Status | Borrower | Loan Amount |
|---|---|---|---|
| Open | Godfrey Barbara A | $84,343 | |
| Previous Owner | Hicks Redd Jacqueline | $63,466 |
Source: Public Records
Tax History
| Year | Tax Paid | Tax Assessment Tax Assessment Total Assessment is a certain percentage of the fair market value that is determined by local assessors to be the total taxable value of land and additions on the property. | Land | Improvement |
|---|---|---|---|---|
| 2025 | $2,274 | $163,517 | $30,000 | $133,517 |
| 2024 | $2,274 | $96,561 | $12,000 | $84,561 |
| 2023 | $1,556 | $96,561 | $12,000 | $84,561 |
| 2022 | $1,358 | $96,561 | $12,000 | $84,561 |
| 2021 | $1,358 | $96,561 | $12,000 | $84,561 |
| 2019 | $1,323 | $77,400 | $12,000 | $65,400 |
| 2018 | $1,323 | $77,400 | $12,000 | $65,400 |
| 2017 | $1,220 | $77,400 | $12,000 | $65,400 |
| 2016 | $1,239 | $88,900 | $12,000 | $76,900 |
| 2015 | $1,227 | $88,900 | $12,000 | $76,900 |
| 2014 | $1,220 | $88,900 | $12,000 | $76,900 |
Source: Public Records
Map
Nearby Homes
- 4487 Ruby Rd
- 758 Amber Dr
- 310 Nugget Ct
- 309 Brass Ct
- 709 Platinum St
- 709 Bluestone Ln
- 802 Darlington Dr
- 808 Darlington Dr
- 801 Darlington Dr
- 836 Durwood Dr
- 1015 Abrams St
- 835 Durwood Dr
- 725 Mosswood Ln
- 780 Joefield Dr
- 635 Mosswood Ln
- 4706 Brandon Ct
- 5726 Edmeston Dr
- 615 Kellam Cir
- 906 Shaw Mill Rd
- 4915 Rosehill Rd
Your Personal Tour Guide
Ask me questions while you tour the home.