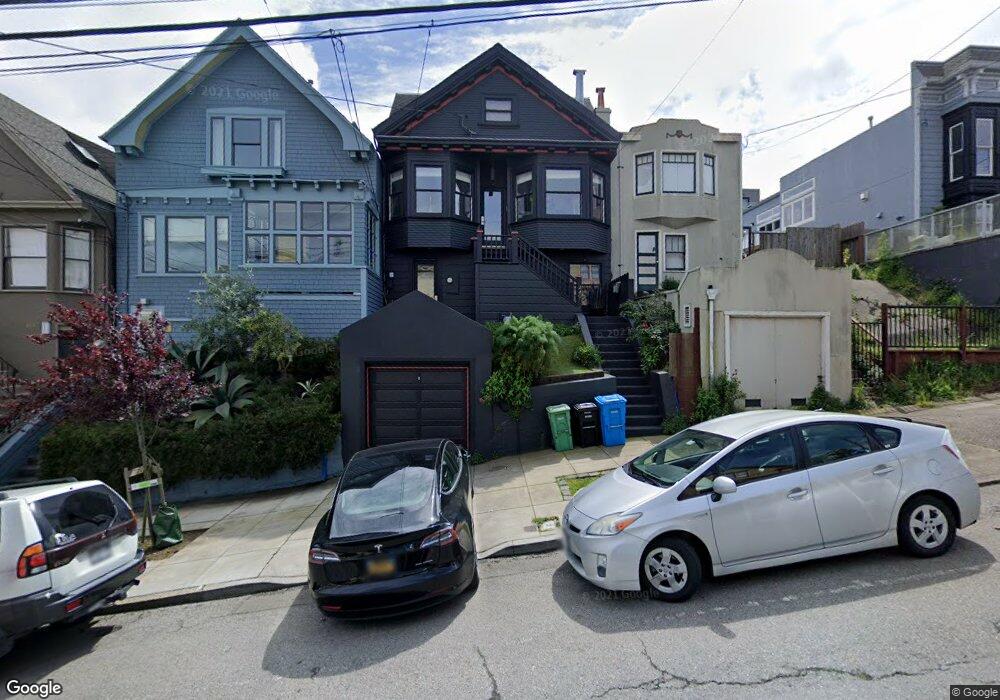
449 Clipper St San Francisco, CA 94114
Noe Valley NeighborhoodEstimated Value: $1,687,000 - $3,392,000
2
Beds
1
Bath
1,074
Sq Ft
$2,070/Sq Ft
Est. Value
About This Home
This home is located at 449 Clipper St, San Francisco, CA 94114 and is currently estimated at $2,223,348, approximately $2,070 per square foot. 449 Clipper St is a home located in San Francisco County with nearby schools including Alvarado Elementary, James Lick Middle School, and St. Philip School.
Ownership History
Date
Name
Owned For
Owner Type
Purchase Details
Closed on
Dec 5, 2001
Sold by
Michael Shannon
Bought by
Boeddeker Steven
Current Estimated Value
Home Financials for this Owner
Home Financials are based on the most recent Mortgage that was taken out on this home.
Original Mortgage
$460,000
Interest Rate
6.12%
Purchase Details
Closed on
Jun 8, 1998
Sold by
Kendall Jones and Corey John
Bought by
Boeddeker Steven and Michael Shannon
Home Financials for this Owner
Home Financials are based on the most recent Mortgage that was taken out on this home.
Original Mortgage
$368,000
Interest Rate
7.17%
Purchase Details
Closed on
Sep 14, 1994
Sold by
Zaczkiewicz Beatrice
Bought by
Jones Kendall
Home Financials for this Owner
Home Financials are based on the most recent Mortgage that was taken out on this home.
Original Mortgage
$231,200
Interest Rate
8.37%
Create a Home Valuation Report for This Property
The Home Valuation Report is an in-depth analysis detailing your home's value as well as a comparison with similar homes in the area
Home Values in the Area
Average Home Value in this Area
Purchase History
| Date | Buyer | Sale Price | Title Company |
|---|---|---|---|
| Boeddeker Steven | $55,000 | First American Title Co | |
| Boeddeker Steven | $460,000 | Fidelity National Title Co | |
| Jones Kendall | $289,000 | North American Title Company |
Source: Public Records
Mortgage History
| Date | Status | Borrower | Loan Amount |
|---|---|---|---|
| Previous Owner | Boeddeker Steven | $460,000 | |
| Previous Owner | Boeddeker Steven | $368,000 | |
| Previous Owner | Jones Kendall | $231,200 |
Source: Public Records
Tax History Compared to Growth
Tax History
| Year | Tax Paid | Tax Assessment Tax Assessment Total Assessment is a certain percentage of the fair market value that is determined by local assessors to be the total taxable value of land and additions on the property. | Land | Improvement |
|---|---|---|---|---|
| 2025 | $12,708 | $1,037,775 | $532,556 | $505,219 |
| 2024 | $12,708 | $1,017,431 | $522,115 | $495,316 |
| 2023 | $12,513 | $997,484 | $511,878 | $485,606 |
| 2022 | $12,270 | $977,930 | $501,843 | $476,087 |
| 2021 | $12,051 | $958,758 | $492,004 | $466,754 |
| 2020 | $12,163 | $948,929 | $486,960 | $461,969 |
| 2019 | $11,749 | $930,326 | $477,413 | $452,913 |
| 2018 | $11,351 | $912,087 | $468,053 | $444,034 |
| 2017 | $10,920 | $894,206 | $458,877 | $435,329 |
| 2016 | $10,730 | $876,677 | $449,881 | $426,796 |
| 2015 | $10,594 | $863,512 | $443,125 | $420,387 |
| 2014 | $10,316 | $846,599 | $434,445 | $412,154 |
Source: Public Records
Map
Nearby Homes
- 4258 26th St
- 1801 Castro St
- 724 27th St
- 4234 24th St
- 538 28th St
- 524 28th St
- 4044 26th St
- 734 Elizabeth St
- 4047 Cesar Chavez St
- 258-260 Jersey St
- 838 Duncan St
- 479 28th St
- 447 Hoffman Ave
- 1463 Noe St
- 222 Jersey St
- 5177 Diamond Heights Blvd Unit 113
- 5177 Diamond Heights Blvd Unit 114
- 1485 Noe St
- 5140 Diamond Heights Blvd Unit 203A
- 5160 Diamond Heights Blvd Unit 107C