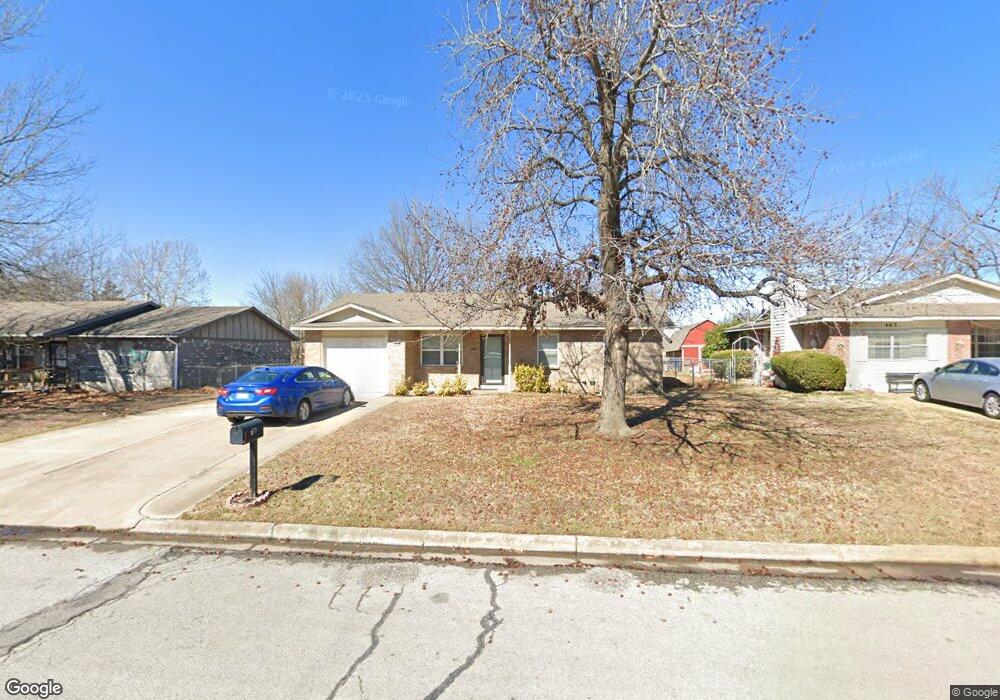
449 E Glenpool Blvd Glenpool, OK 74033
Estimated Value: $175,000 - $185,000
3
Beds
2
Baths
1,158
Sq Ft
$155/Sq Ft
Est. Value
About This Home
This home is located at 449 E Glenpool Blvd, Glenpool, OK 74033 and is currently estimated at $179,380, approximately $154 per square foot. 449 E Glenpool Blvd is a home located in Tulsa County with nearby schools including Glenpool Elementary School, Glenpool Middle School, and Glenpool High School.
Ownership History
Date
Name
Owned For
Owner Type
Purchase Details
Closed on
Dec 5, 2019
Sold by
Cdre Investments Llc
Bought by
Monrach Strategies Llc
Current Estimated Value
Home Financials for this Owner
Home Financials are based on the most recent Mortgage that was taken out on this home.
Original Mortgage
$1,669,500
Outstanding Balance
$1,463,674
Interest Rate
3.75%
Mortgage Type
Commercial
Estimated Equity
-$1,284,294
Purchase Details
Closed on
Jun 7, 2019
Sold by
Henderson Chris and Henderson Krissi
Bought by
Cdre Investments Llc
Purchase Details
Closed on
Nov 29, 2018
Sold by
Glenpool Properties Llc
Bought by
Henderson Chris
Home Financials for this Owner
Home Financials are based on the most recent Mortgage that was taken out on this home.
Original Mortgage
$1,375,000
Interest Rate
4.8%
Mortgage Type
Commercial
Purchase Details
Closed on
Sep 24, 2015
Sold by
Ferrell Sandra Lynn and Ferrell Sandra Lynn
Bought by
Glenpool Properties Llc
Purchase Details
Closed on
Feb 26, 2010
Sold by
Fannie Mae
Bought by
Ferrell Allen and Fereell Sandra
Home Financials for this Owner
Home Financials are based on the most recent Mortgage that was taken out on this home.
Original Mortgage
$68,000
Interest Rate
4.98%
Mortgage Type
Commercial
Purchase Details
Closed on
Nov 17, 2009
Sold by
Anderson Brian
Bought by
Federal National Mortgage Association
Purchase Details
Closed on
Aug 3, 2006
Sold by
Anderson Brian and Anderson Kasey
Bought by
Anderson Brian and Anderson Kasey
Home Financials for this Owner
Home Financials are based on the most recent Mortgage that was taken out on this home.
Original Mortgage
$66,600
Interest Rate
6.66%
Mortgage Type
Stand Alone Refi Refinance Of Original Loan
Purchase Details
Closed on
Jul 27, 2006
Sold by
Jp Morgan Chase Bank
Bought by
Anderson Brian T
Home Financials for this Owner
Home Financials are based on the most recent Mortgage that was taken out on this home.
Original Mortgage
$66,600
Interest Rate
6.66%
Mortgage Type
Stand Alone Refi Refinance Of Original Loan
Purchase Details
Closed on
Mar 23, 2006
Sold by
Hudson James V and Hudson Linda M
Bought by
Jp Morgan Chase Bank
Purchase Details
Closed on
Feb 22, 2000
Sold by
Lowman Joseph M and Lowman Deborah L
Bought by
Hudson James and Hudson Linda M
Home Financials for this Owner
Home Financials are based on the most recent Mortgage that was taken out on this home.
Original Mortgage
$47,500
Interest Rate
11.3%
Mortgage Type
Purchase Money Mortgage
Purchase Details
Closed on
May 1, 1997
Create a Home Valuation Report for This Property
The Home Valuation Report is an in-depth analysis detailing your home's value as well as a comparison with similar homes in the area
Home Values in the Area
Average Home Value in this Area
Purchase History
| Date | Buyer | Sale Price | Title Company |
|---|---|---|---|
| Monrach Strategies Llc | $1,669,500 | First American Title Ins Co | |
| Cdre Investments Llc | -- | None Available | |
| Henderson Chris | $67,000 | None Available | |
| Glenpool Properties Llc | -- | -- | |
| Ferrell Allen | $64,500 | Multiple | |
| Federal National Mortgage Association | -- | None Available | |
| Anderson Brian | -- | First American Title & Abstr | |
| Anderson Brian T | $74,000 | First American Title & Abstr | |
| Jp Morgan Chase Bank | -- | None Available | |
| Hudson James | $38,500 | -- | |
| -- | $38,500 | -- |
Source: Public Records
Mortgage History
| Date | Status | Borrower | Loan Amount |
|---|---|---|---|
| Open | Monrach Strategies Llc | $1,669,500 | |
| Previous Owner | Henderson Chris | $1,375,000 | |
| Previous Owner | Ferrell Allen | $68,000 | |
| Previous Owner | Anderson Brian | $66,600 | |
| Previous Owner | Hudson James | $47,500 |
Source: Public Records
Tax History
| Year | Tax Paid | Tax Assessment Tax Assessment Total Assessment is a certain percentage of the fair market value that is determined by local assessors to be the total taxable value of land and additions on the property. | Land | Improvement |
|---|---|---|---|---|
| 2025 | $1,883 | $15,710 | $2,007 | $13,703 |
| 2024 | $1,668 | $14,962 | $2,121 | $12,841 |
| 2023 | $1,668 | $14,250 | $2,204 | $12,046 |
| 2022 | $1,564 | $13,571 | $2,299 | $11,272 |
| 2021 | $1,512 | $12,925 | $2,189 | $10,736 |
| 2020 | $1,524 | $12,925 | $2,189 | $10,736 |
| 2019 | $1,208 | $10,175 | $2,189 | $7,986 |
| 2018 | $1,160 | $9,817 | $1,948 | $7,869 |
| 2017 | $1,081 | $9,350 | $1,855 | $7,495 |
| 2016 | $1,092 | $9,350 | $1,855 | $7,495 |
| 2015 | $946 | $8,218 | $1,855 | $6,363 |
| 2014 | $905 | $7,752 | $1,750 | $6,002 |
Source: Public Records
Map
Nearby Homes
- 265 E Glenpool Blvd
- 603 E 135th Place
- 13653 S Hickory Place
- 582 E 133rd Place
- 13674 S Maple St
- 1104 E 137th St
- 13294 S Maple St
- 1159 E 137th St
- 13796 S Nyssa Place
- 243 E 141st St
- 1211 E 135th St
- 14692 S College St
- 1218 E 133rd Place
- 13761 S Nyssa Ct
- 13706 Peabody Dr
- 1188 E 143rd St
- 41 E 148th St
- 1671 E 140th St
- 1122 E 144th Place
- 13773 S Oak Place
- 463 E Glenpool Blvd
- 421 E Glenpool Blvd
- 430 E 137th St
- 407 E Glenpool Blvd
- 485 E Glenpool Blvd
- 416 E 137th St
- 458 E 137th St
- 392 E 137th St
- 456 E Glenpool Blvd
- 383 E Glenpool Blvd
- 474 E 138th Place
- 432 E Glenpool Blvd
- 493 E Glenpool Blvd
- 410 E Glenpool Blvd
- 13804 S Fern St
- 375 E Glenpool Blvd
- 364 E 137th St
- 13732 S Fern St
- 437 E 137th St S
- 445 E 137th St
Your Personal Tour Guide
Ask me questions while you tour the home.